Mean Circulation Highlights and Climate Anomalies May through August 2014
Anthony Artusa, Meteorologist, Operations Branch, Climate Prediction Center NCEP/NWS/NOAA
May-June 2014
The mid tropospheric circulation during May featured above average 500 hPa heights over the far northern Pacific, northeast Canada, and western Russia. It also featured below average heights over the central North Pacific, the Grand Banks area off Newfoundland, southeast Europe, and the polar region Figure 1. The sea level pressure (SLP) pattern is only a weak reflection of the 500 hPa height anomaly pattern, with above average SLP over the high latitudes of the North Pacific and northeast Canada, and below average SLP across the polar region Figure 2. The 500 hPa circulation during June featured above average heights over the high latitudes of the North Pacific, eastern Canada, and the high latitudes of the North Atlantic, while below average 500 hPa heights dominated Alaska and much of western North America Figure 3. As was the case in May, the June SLP pattern broadly resembled its corresponding 500 hPa pattern, but was very weak Figure 4. According to the National Climatic Data Center, a late season snowstorm was responsible for increasing snow depth by a full meter across the Central Rockies from May 11-13, causing power outages and highway closures. In June, above average temperatures and dry conditions in California led to an 11 percent increase in coverage of exceptional drought (the worst category), now covering 36.5 percent of the state (Reference 1).
The Tropics
Sea surface temperatures (SSTs) remained above average in the eastern and central equatorial Pacific in May, and above average across much of the equatorial Pacific in June. The latest monthly Nino index for the Nino 3.4 regions was +0.5C in both May and June. The depth of the oceanic thermocline (measured by the depth of the 20C isotherm) was above average in parts of the central and eastern equatorial Pacific, with subsurface temperatures ranging from 2-5C above average in May, and 1-4C above average in June. Equatorial low level easterly trade winds remained near average across the central and east central Pacific during the two month period, with tropical convection near average in May, and above average in the central Pacific in June. Collectively, these indicators reflect ongoing ENSO neutral conditions.
July-August 2014
The 500 hPa circulation pattern during July featured below average heights over east central North America, southwest Europe, and central Russia, while above average heights prevailed over western North America, far eastern Canada, Scandinavia, and the Bering Sea area < href="#Figure5">Figure 5. The SLP and Anomaly map for July depicts above average SLP in Scandinavia and the Bering Sea, with only very modest spatial coverage of below average SLP Figure 6.
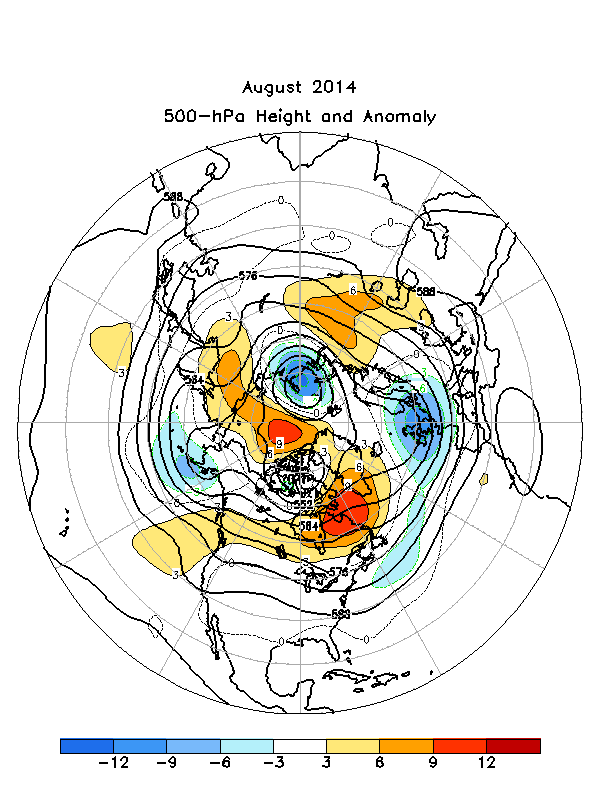
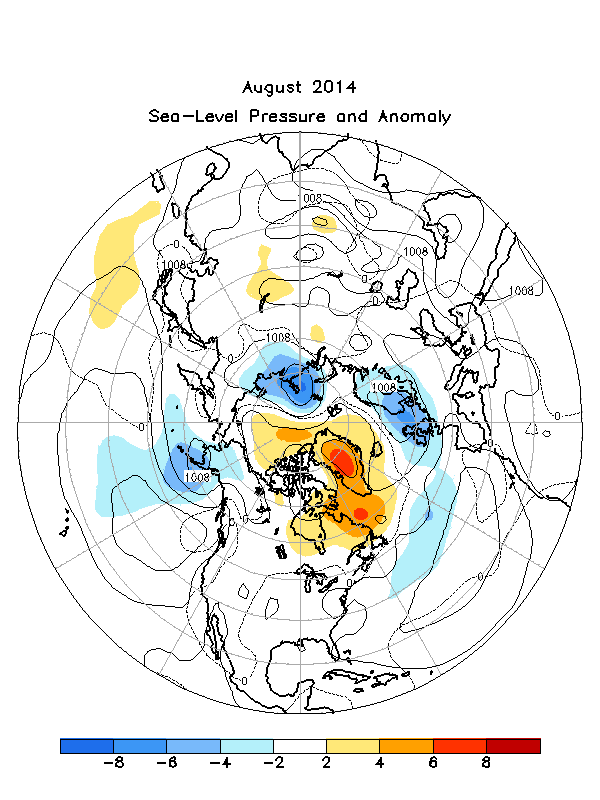
The month of August was characterized by below average 500 hPa heights over southern Alaska, northwest Europe, and far northern Russia (Kara Sea region). Above average heights were observed over Canada, Greenland, and west central Russia Figure 7. The SLP and Anomaly map shows a weak reflection of the upper air height anomaly pattern Figure 8.
According to the National Climatic Data Center, above average temperatures in July contributed to worsened drought conditions across much of the West. In California, the percent area of the state experiencing exceptional drought, the worst category, expanded to 58.4 percent, up nearly 22 percent since the start of the month. Warm conditions fueled large wildfires in the Pacific Northwest, including the Carlton Complex Fire in Okanogan County in north central Washington state, which charred a quarter of a million acres. In Alaska, Cold Bay reported its warmest month of any month on record, with an average temperature of +13.2C, while Juneau and Fairbanks had their second wettest July. On August 7, Tropical Storm Iselle made landfall on Hawaii's Big Island, with maximum sustained winds of 52 kts. This was the strongest tropical cyclone on record to make landfall on the Big Island and was the first tropical cyclone to make landfall anywhere in Hawaii since Hurricane Iniki in 1992. On August 12-13, a slow moving storm system brought 34.5 cm of rain to Islip, NY (central Long Island) over a 24 hour period, setting a new state 24 hour precipitation record for New York Reference 2.
The Tropics
ENSO neutral conditions persisted through July and August 2014. SSTs were near average across the central and east central portions of the equatorial Pacific (July and August) and above average over the far eastern Pacific (July) and west central and eastern Pacific (August). The latest monthly Nino indices for the Nino 3.4 region was +0.2C for both months. The depth of the oceanic thermocline ranged from near average in the central and eastern equatorial Pacific in July and above average in much of the equatorial Pacific in August. Subsurface temperatures ranged from 1-2C above average. Equatorial low level easterly trade winds were near average across the Pacific (July) and near average in the western and west central Pacific (August). Tropical convection remained enhanced over the tropical North Pacific (July) and suppressed across the western Pacific (August).
References
1. http://www.ncdc.noaa.gov/sotc/national/2014/5 (May) and /6 (June)
2. http://www.ncdc.noaa.gov/sotc/national/2014/7 (July) and /8 (August)
Much of the information used in this article originates from the Climate Diagnostics Bulletin archive: (http://www.cpc.ncep.noaa.gov/products/CDB/CDB_Archive_html/CDB_archive.shtml)
Back to top


