Wave Setup during Hurricane Katrina and Tropical Cyclone Mahina
S. A. Hsu and Baozhu Liu Coastal Studies Institute sahsu@lsu.edu
Abstract
On the basis of wave setup measurements during Tropical Cyclone Mahina in the South Pacific and Hurricane Katrina in the Gulf of Mexico, it is found that, during a tropical cyclone over an open and flat coast, the maximum wave setup (in meters) = 0.15Hsmax = 0.030(1013-Po), where Hsmax is the max significant wave height in meters in deep water before shoaling and Po is the minimum sea-level pressure in hPa before landfall. This wave setup needs to be added to the storm surge produced jointly by the barometric tide, the Coriolis tide, and the wind-stress tide in order to get more accurate total inundation for optimum ship mooring and coastal engineering projects.
1. Introduction
According to Dean and Dalrymple (2002), the total storm surge includes the sum of following four components: the barometric tide, the wind-stress tide (see, e.g. Hsu, 2013), the Coriolis tide, and the wave setup, which is a phenomenon that occurs primarily within the wave breaking zone and results a super elevation of the water level.
According to Nott et al. (2014), new evidence suggests Tropical Cyclone Mahina on 5 March 1899 near Bathurst Bay, northeast Australia, had a central pressure (Po) of 880hPa and could have produced a maximum storm surge of approximately 9m and a total inundation of roughly 13m. The purpose of this brief note is to provide some confirmation of Nott et al (2014) using more recent measurements during Hurricane Katrina in August 2005 near Long Beach, MS, USA. Furthermore, knowledge of the magnitude of wave setup is needed for many practical applications such as optimum ship mooring, structural damage assessments, and coastal engineering projects.
2. Met-Ocean Conditions near Katrina’s Landfall
The meteorological and oceanographic (met-ocean) conditions as represented by the atmospheric pressure and ocean waves are briefly described as follows: According to Knabb et al. (2005), Hurricane Katrina made landfall near Buras, LA on 29 August at 1110UTC with Po = 920 hPa (or mb)and near LA/MS border 3 hours and 35 minutes later with Po = 928 hPa (see Fig.1). On the right-hand side of the track, the National Data Buoy Center (NDBC) operated 2 stations: 42007 and 42040 for our analysis. As shown in Fig.2, Po = 927.4 hPa. The significant wave height, Hs, defined as the average height of the highest one-third of the waves observed at a specific point (see, e.g., Hsu, 1988), is plotted in Fig. 3. The maximum Hs, Hsmax, is approximately 16.91m or 55ft.
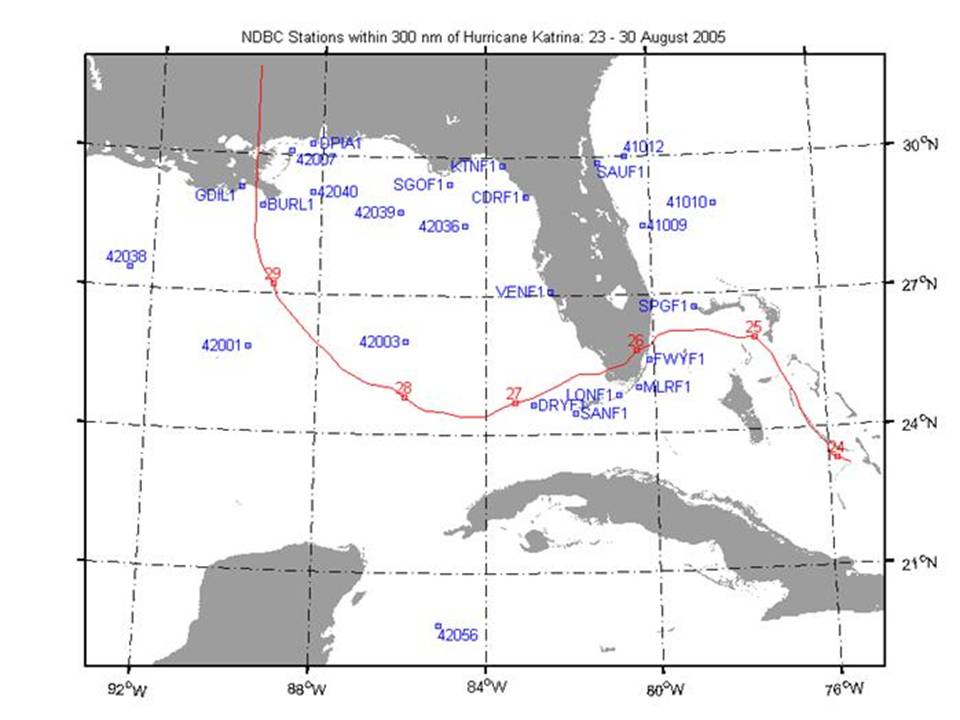
Fig.1. Hurricane Katrina's track and NDBC stations. Katrina's track (in red with the start of each day numbered) is from the positions of the National Hurricane Center's Forecasts/Advisories (http://www.ndbc.noaa.gov/hurricanes/2005/katrina/ ).
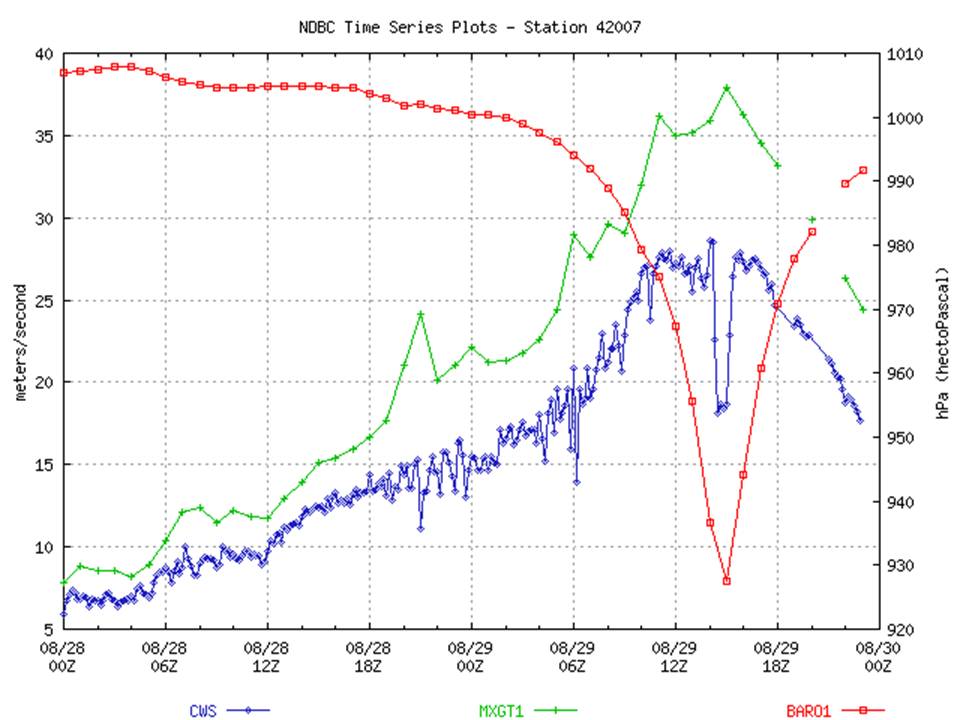
Fig.2. Station 42007: Winds (Anemometer Height 5m) and Sea-level Pressure (http://www.ndbc.noaa.gov/hurricanes/2005/katrina/). Note that Po = 927.4hPa. For station location, see Fig.1. ).
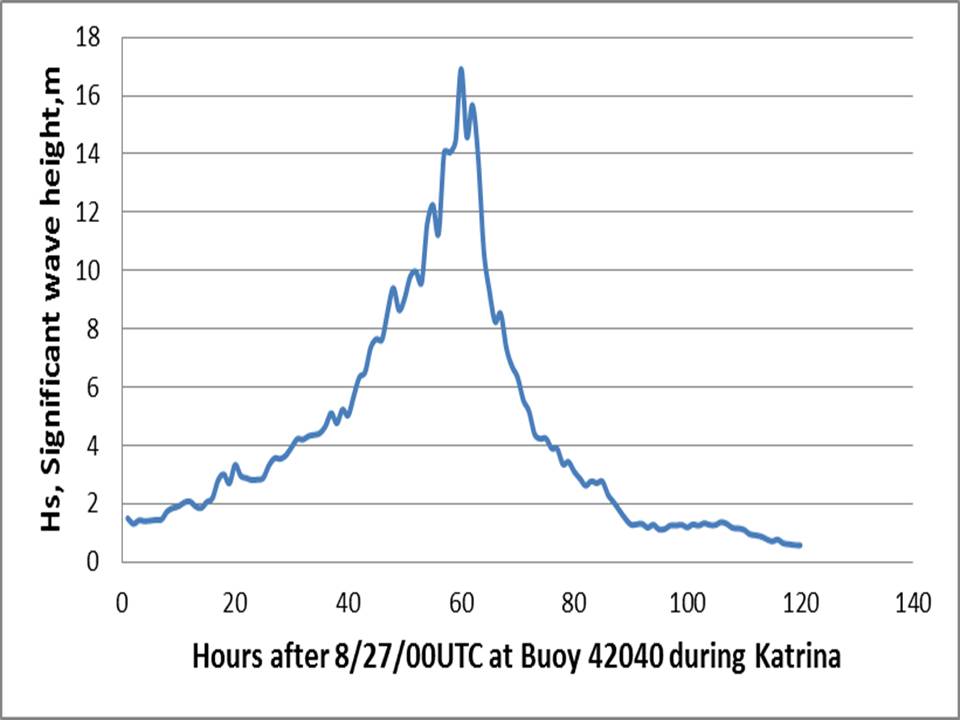
Fig.3. Deep water significant wave height measurements at NDBC Buoy 42040 during Katrina. (Data source: http://www.ndbc.noaa.gov). Note that Hsmax = 16.91m or 55ft. For station location, see Fig.1.
3. Wave setup measurement during Katrina
According to Guza and Thornton (1981), the max wave setup, Wsetmax, is linearly related to Hsmax , so that Wsetmax = A Hsmax (1) Where the coefficient, A, needs to be determined from measurements and Hsmax is the maximum significant wave height in deep-water before shoaling. Both units of Wsetmax and Hsmax are in meters. From field experiments, Guza and Thornton (1981) have determined that A = 0.17. As illustrated in Fig.4, the wave setup can be estimated as the difference between the high water mark outside the structure and HWM inside the structure. Based on Stations KMSC-05-12 and KMSC-05-17 in Fig.5, the maximum wave setup = 33ft-25ft = 8ft during Katrina. Now, from Fig.3, Hsmax =16.91m or 55ft. Substituting these values into Eq. (1), we have A = 8ft/55ft = 0.15 so that Wsetmax = 0.15 Hsmax (2) According to Hsu (2014), for practical use, Hsmax = 0.2(1013 - Po) (3) Now, substituting Eqs.(3) into (2), we get Wsetmax = 0.15 Hsmax = 0.030(1013 – Po) (4) For quality assurance, substituting Po = 927.4hPa from Fig. 2 into Eq. (3), one gets Hsmax = 17m and into Eq. (4) Wsetmax = 2.57m or 8ft. Since these results are nearly identical to the measured 16.91m (see Fig.3) for H smax and 8ft for wave setup as stated above, Eqs. (3) and (4) may be used to evaluate the results of Nott et al. (2014).
4. Wave setup during Tropical Cyclone Mahina
Now, according to Nott et al. (2014) as stated in the introduction, Po = 880hPa. Substituting this value into Eq. (4), we get the wave setup to be 4m. Since the wave setup during Mahina = total inundation - surge = 13m - 9m = 4m, which is identical to our result, we can say that the conclusions reached by Nott et al. (2014) is plausible.
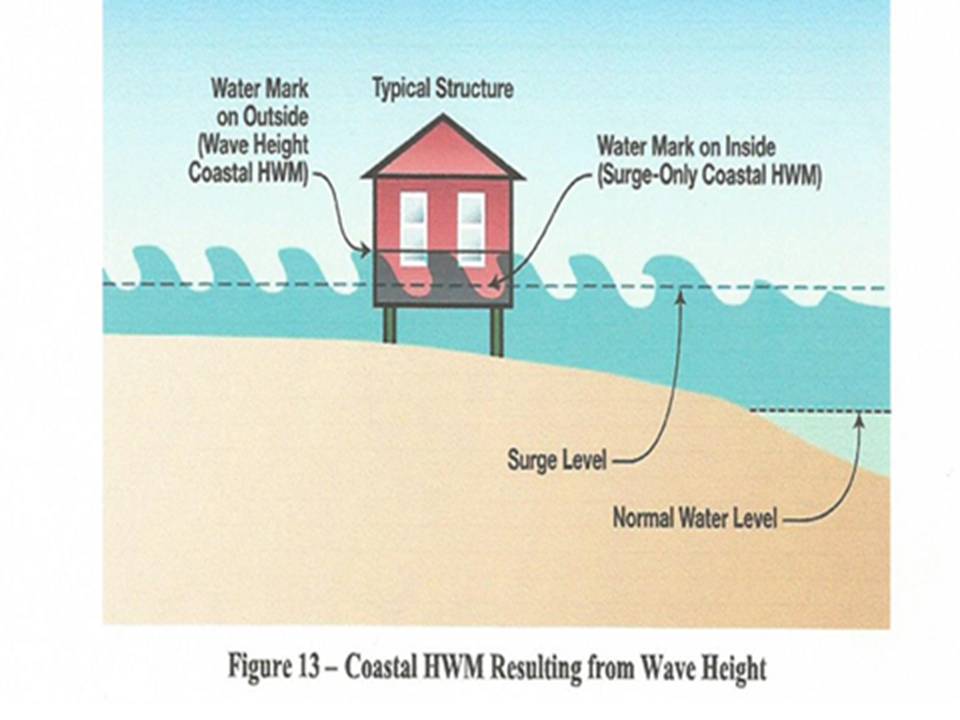
Fig.4. An illustration of wave setup = (high water mark outside – high water mark inside the structure) (See FEMA, 2006). Note that HWM stands for High Water Mark.
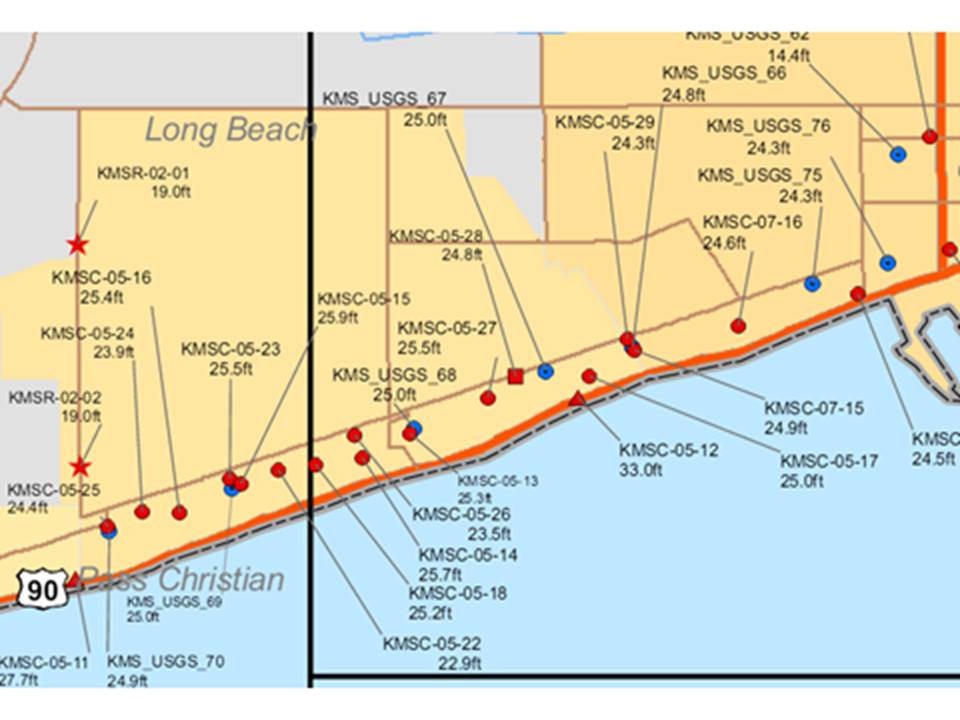
Fig.5. A section of HWM surveys along MS after Katrina (see FEMA, 2006). Note that an 8ft wave setup existed as a result of the difference between total inundation of 33ft at station KMSC-05-12 and the 25ft surge-only at nearby KMSC-05-17 (see FEMA, 2006).
5. Conclusions
On the basis of aforementioned discussions, it is concluded that the results presented by Nott et al. (2014) are plausible since they are supported by more recent measurements during Hurricane Katrina. Certainly, more measurements of wave setup during tropical cyclones worldwide are needed to further substantiate Eq. (4).
Acknowledgements
Many thanks go to NDBC for providing buoy data and graphs related to Katrina and to FEMA for high water mark surveys and wave setup illustration.
References
Dean, R. G., and R. A. Dalrymple, 2002, Coastal Processes with Engineering Applications, Cambridge University Press.
FEMA, 2006, Final Coastal and Riverine High Water Mark Collection for Hurricane Katrina in MS, FEMA-1604-DR-MS, Task Orders 413 and 420.
Guza, R. T., and E. B. Thorton, 1981: Wave set-up on a natural beach, J. Geophys. Res., 96, 4133-4137.
Hsu, S. A., 1988: Coastal Meteorology, Academic Press.
Hsu, S. A., 2013: Storm surges in New York during Hurricane Sandy in 2012: A verification of the wind-stress tide relation, Boundary-Layer Meteorology, 148(3), 593-598.
Hsu, S. A., 2014: Rapid estimations of air-sea-land interaction parameters during a tropical cyclone. Global Journal of Researches in Engineering: E, Civil and structural Engineering, 14(2), 1-16.
Knabb, R. D., J. R. Rhome, and D. P., Brown, 2005: Tropical Cyclone Report, Hurricane Katrina, National Hurricane Center (www.nhc.noaa.gov).
Nott, J., C. Green, I.Townsend, and J. Callaghan, 2014: The world record storm surge and the most intense southern hemisphere tropical cyclone, new evidence and modeling. Bull. Amer. Meteor. Soc., 95, 757-765.
Back to top
