Mean Circulation Highlights and Climate Anomalies March through August 2003
A. James WagnerSenior Forecaster
Forecast Operations Branch
Climate Prediction Center NCEP/NWS/NOAA.
MARCH - APRIL 2003
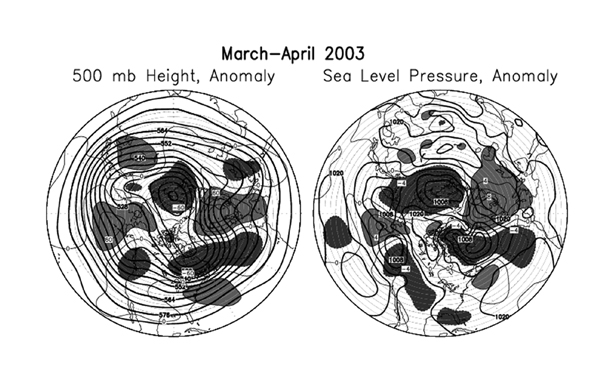
The map of mean 500-mb(hPa) height and height anomalies (left) show a rather complex but generally amplified wave train around the Northern Hemisphere. At high latitudes a wave two pattern prevailed, with troughs over Siberia and northeastern Canada, sandwiched between blocking ridges over the Bering Sea and northern Europe. At middle and lower latitudes, troughs were located near the west coast of North America, across the central Atlantic with a WNW-ESE axis, and over the eastern Mediterranean Sea. A broad flat ridge was located just off the East Coast of the U.S. Storm tracks were about normal over the Pacific, but tended to extend southeastward from British Columbia to the central U.S., where they had a tendency to weaken, except for one system that gave record heavy snows to the Front Range of the Colorado Rockies. Storms over the Atlantic were deflected to the southeast off the coast of Portugal by the strong blocking high pressure over the Baltic and Greenland Seas. This unusually strong area of high pressure also displaced the Icelandic Low, which was stronger than normal, west of its usual position to near southern Greenland. The frequent storms that had affected the Mediterranean area during the winter continued through much of the spring in the eastern part of the area, as some energy in the westerlies made its way across southern Europe to the south of the high.
Unusually cold air remained in place over most of eastern and central Canada, extending as far south as the Great Lakes and New England, while relatively mild temperatures developed over much of the central and southeastern U.S., bringing welcome relief from the long cold winter. Above average precipitation prevailed over the Pacific Northwest in March and extended southward along the entire West Coast during April, when the trough, which had been confined to only the British Columbia coast during March, amplified southward along the entire West Coast of the U.S. The wet spell continued over the Southeast, while dry areas began to appear over the central parts of the country. The strong ridge at the surface and aloft over Europe blocked most Atlantic storms from reaching the area, setting the stage for the severe drought and heat wave that developed during the summer.
Over the Pacific, El Nino conditions, characterized by above normal sea surface temperature (SST) along the equator in the central and eastern parts of the ocean, declined rapidly and were replaced by below normal SSTs off the South American coast, suggesting that a La Nina might be about ready to begin. However, most atmospheric indices, which usually lag the ocean in the lower latitudes, remained in the neutral range.
 |
|
The chart above shows the seasonal mean sea level pressure at four mb (hPa) intervals in heavy solid lines, labeled in mb(hPa). Anomalies of Sea Level Pressure (SLP) are contoured in dashed lines and labeled at two mb(hPa) intervals, with heavy shading and light solid lines in areas greater than two mb(hPa) above normal, and light shading and light dashed lines in areas more than two mb(hPa) below normal. |
MAY - JUNE 2003
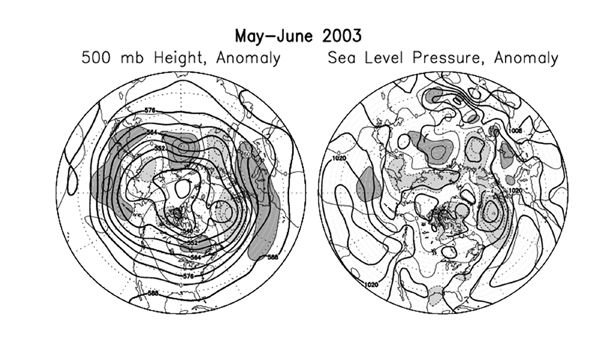
The circulation during the late spring and early summer months became more zonal over the Western Hemisphere with mostly small departures from normal as shown on the two-month mean maps. However, there was a significant change over the U.S. from a moderately fast westerly pattern in May to a more amplified configuration of a strong ridge just off the West Coast and a trough in the middle Mississippi Valley during June.
This caused most of the U.S. east of the Rockies to be noticeably cooler than normal, due mainly to extensive periods of cloudy wet weather that cut down on the solar heating. Although the circulation for the whole two-month season or even May by itself does not give an adequate explanatory picture, frequent vigorous short wave troughs in the westerlies coming in from the Pacific, coupled with a strong low-level moisture inflow from the Gulf of Mexico during the first two weeks of May, led to an unprecedented number of tornados over central and eastern parts of the U.S.
The circulation became strongly zonal over the eastern Atlantic, with a southward-displaced stronger than normal Icelandic Low just north of an extensive enhanced ridge extending from the eastern Atlantic across the Mediterranean and all of southern Europe. Abnormally warm weather began to develop over southern and central Europe, while the drought intensified. Farther to the east over Russia, the circulation became more amplified, especially during June, with a strong ridge located between troughs near the Ural mountains and eastern Siberia.
Over the tropical Pacific, the development of La Nina conditions was abruptly halted by an oceanic Kelvin wave initiated by a strong burst of west winds over the western Pacific. Equatorial SSTs were at least 1 C above normal over and just west of the Date Line, while areas of cooler than normal water over the east-central equatorial Pacific decreased. The only decidedly below normal SSTs were located just off the west coast of South America. After moving from a rapidly weakening El Nino pattern towards a weak La Nina configuration during the past three or four months, most atmospheric and oceanic indices paused in their trends, ending up in neutral territory.
A total of three tropical systems, all of tropical storm intensity, formed over the eastern Pacific, and one made landfall in western Mexico. In the Atlantic, after Ana, which developed in April and was the earliest tropical storm on record in the Atlantic sector, there was one other unnamed tropical depression east of the Antilles in early June, and tropical storm Bill contributed to the above average rainfall along the central Gulf coast and parts of the Southeast at the end of the month.
 |
|
The chart above shows the seasonal mean sea level pressure at four mb (hPa) intervals in heavy solid lines, labeled in mb(hPa). Anomalies of Sea Level Pressure (SLP) are contoured in dashed lines and labeled at two mb(hPa) intervals, with heavy shading and light solid lines in areas greater than two mb(hPa) above normal, and light shading and light dashed lines in areas more than two mb(hPa) below normal. |
JULY - AUGUST 2003
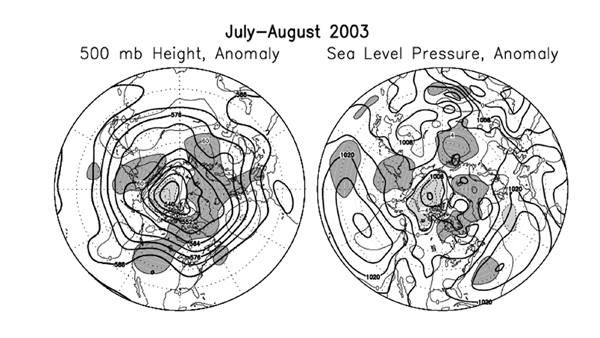
A moderately amplified version of the normal summertime circulation pattern prevailed in the vicinity of North America, with troughs off the West Coast and extending from Quebec southward through the Appalachians. Between the troughs, a strong ridge over the High Plains extended northeastward across central Canada, and was a part of a large area of higher than normal pressure both at the surface and aloft that extended across the North Atlantic to join with other amplified ridges over western Russia and central Europe. This latter feature became exceptionally strong and shifted over western Europe during the first half of August, leading to an unprecedented heat wave that set all time high temperature records at many locations with records dating back well over a century. The heat was exacerbated by drought and wildfires, especially over more southern locations which had gone longer without significant rainfall.
Record and near-record heat and increasing drought also plagued parts of the United States, especially the Southwest in early July where the summer monsoon was one to two weeks late, and over the central Great Plains and parts of the Rockies throughout July, under the influence of the strong ridge. Numerous wildfires affected the Southwest and the Rocky Mountains during late June and early July. During August the strongest part of the ridge was over the northern Great Plains and upper Mississippi Valley, where many high temperature records were set in areas of expanding drought. Most areas east of the Mississippi River continued to have wetter than normal conditions due to slowly-moving weak frontal systems stalling in the mean trough over the Southeast. Heavy rainfall over southern Texas was due to Hurricane Claudette during July, and a weak tropical depression contributed to the totals over Georgia.
 |
|
The chart above shows the seasonal mean sea level pressure at four mb (hPa) intervals in heavy solid lines, labeled in mb(hPa). Anomalies of Sea Level Pressure (SLP) are contoured in dashed lines and labeled at two mb(hPa) intervals, with heavy shading and light solid lines in areas greater than two mb(hPa) above normal, and light shading and light dashed lines in areas more than two mb(hPa) below normal. |
About The Author
A. James Wagner is the Senior Forecaster in the Forecast Operations Branch of the Climate Prediction Center NCEP/NWS/NOAA. He participates in the preparation of all the types of forecasts done in the Branch: the 6-10 Day Extended Outlooks, Week Two Outlooks, weekly Hazards Assessment, Monthly Outlooks, and the series of long-lead Seasonal Outlooks going out to a year ahead. Other duties of Mr. Wagner include applied research in developing tools for the various types of forecasts and giving special briefings on the forecasts and their methodology to the media and visiting scientists.
Page last modified: