Mean Circulation Highlights and Climate Anomalies May through August 2009
Anthony Artusa, Meteorologist, Climate Operations Branch, Climate Prediction Center NCEP/NWS/NOAA
May - June 2009
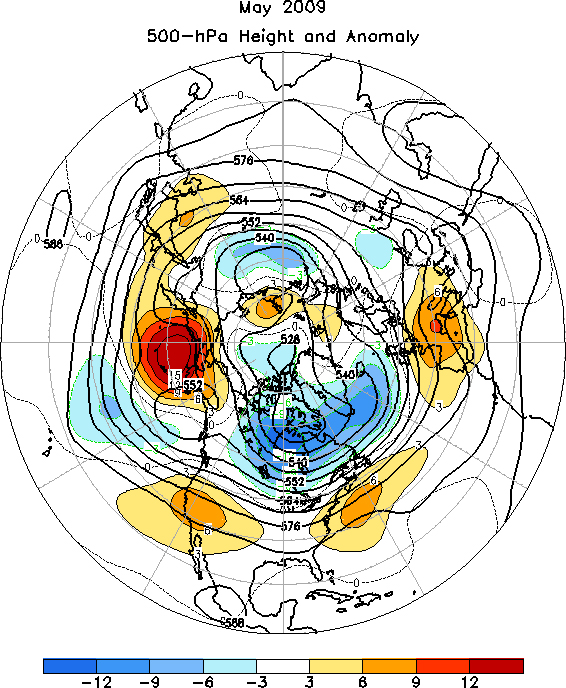
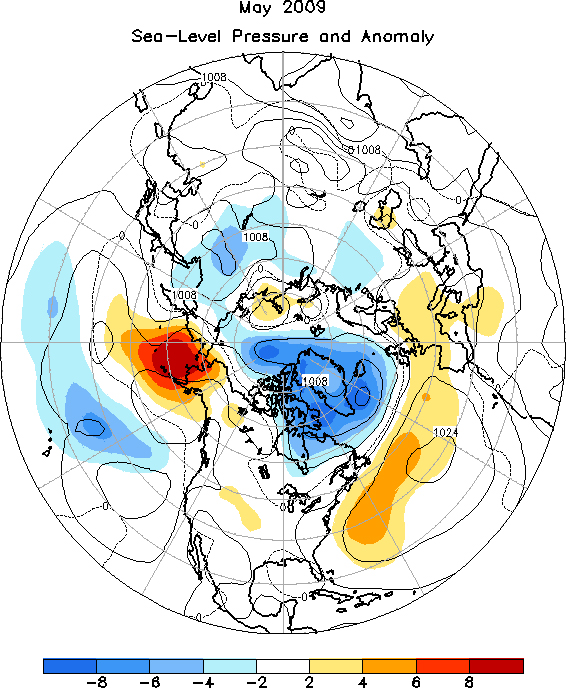
The 500-hPa circulation pattern over the Northern Hemisphere during May featured positive anomalies over the high latitudes of the central North Pacific and from the western U.S. to southern Europe, and negative anomalies over eastern Canada, the high latitudes of the North Atlantic, and north-central Russia Figure 1. Over the Pacific Ocean the circulation continued to reflect a westward retraction of the East Asian jet stream in association with the lingering La Nina signal. Sea-level pressure (SLP) was well below average over the far northern Atlantic, including Greenland, Iceland, and Baffin Island, Canada. Above average SLP was observed over the Bering Sea area, as well as the temperate North Atlantic Figure 2.
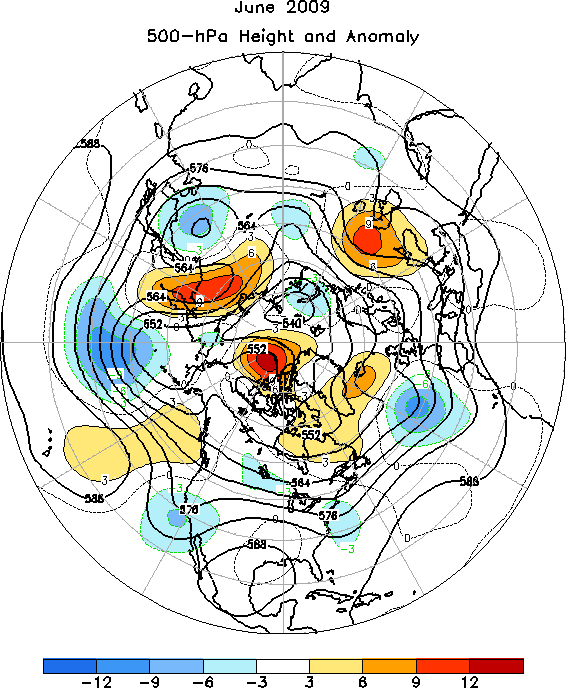
During June, the 500-hPa circulation pattern featured large areas of negative anomalies in the middle latitudes and generally positive anomalies at high latitudes Figure 3. This pattern was associated with large amplitude troughs over the central North Pacific, the western U.S., the eastern North Atlantic, and Mongolia. Ridges were observed over the high latitudes of the North Atlantic, near the Caspian Sea, and over eastern Siberia. Th e SLP anomaly pattern largely mirrored the 500-hPa height anomaly pattern across the Northern Hemisphere during June Figure 4.
The Tropics
ENSO-neutral conditions persisted across the equatorial Pacific Ocean during May. However, sea surface temperature (SST) anomalies in the eastern equatorial Pacific continued to increase. The latest monthly SST index was +0.3C in the Nino-3.4 region. The oceanic thermocline along the equator, measured by the depth of the 20C isotherm, remained deeper than average across the equatorial Pacific Ocean during May, while temperatures were 1.0 to 3.0C above average at thermocline depth across the equatorial Pacific. Although these oceanic anomalies reflected ENSO-neutral conditions, some lingering La Nina signals were still evident in the atmosphere. In June, SST anomalies continued to increase across the equatorial Pacific Ocean. The latest monthly SST index was +0.6C in the Nino-3.4 region. In addition, the low-level equatorial easterly winds were weaker than average across the central and eastern Pacific, and convection became increasingly suppressed over Indonesia. This coupling of the oceanic and atmospheric anomalies indicates the development of El Nino. The east Pacific hurricane season in particular was off to an unusually late start, with the first named storm finally developing on June 21st.
July - August 2009
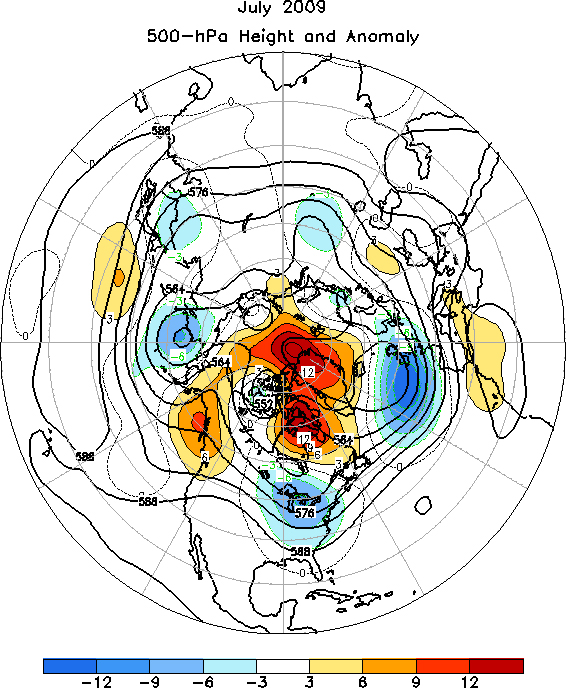
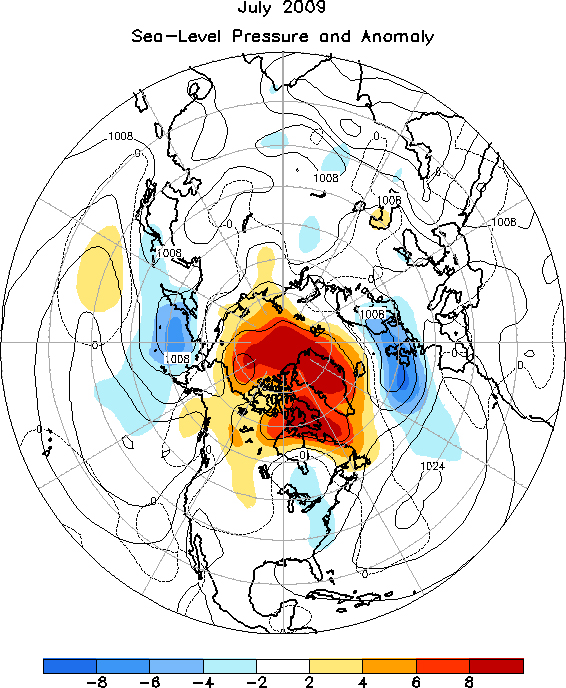
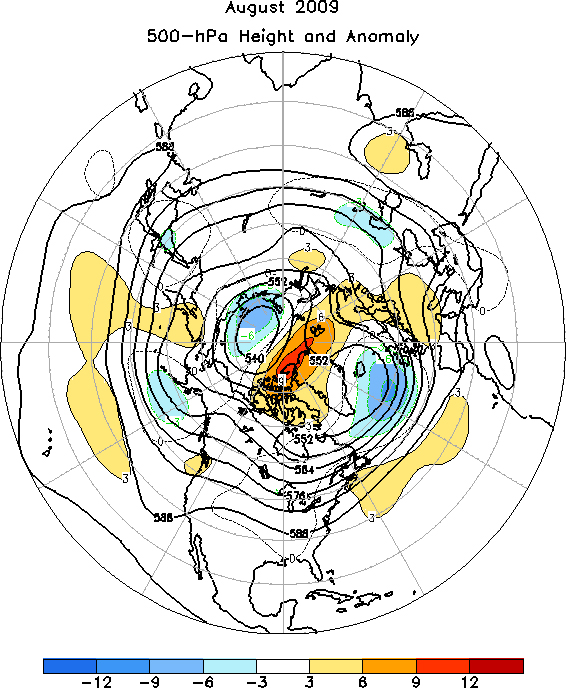
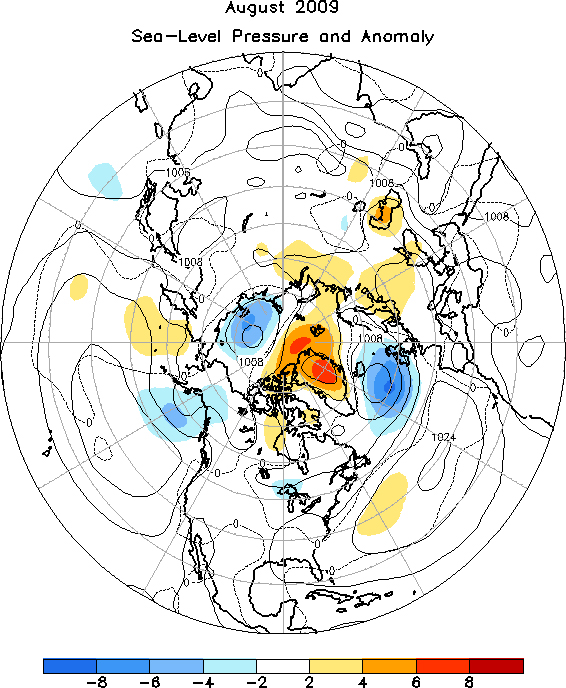
The mean circulation over the Northern Hemisphere for July 2009 featured positive anomalies in the polar region, and negative anomalies from eastern North America to northern Europe and over the high latitudes of the central North Pacific Figure 5. Over the North Atlantic, the circulation reflected a strong negative phase of the North Atlantic Oscillation (NAO). In August, the 500-hPa height field was characterized by positive anomalies in the polar region, the central North Pacific, the mid-latitude Atlantic, and western Europe, with negative anomalies in the Gulf of Alaska, the high latitudes of the North Atlantic, south-central Russia, and over the Arctic Ocean on the Asian side of the Pole Figure 6. The SLP field in July featured generally belowaverage pressure across the middle latitudes and above-average pressure at high latitudes Figure 7. This pattern reflected a record negative phase of the Arctic Oscillation (AO) for July dating back to 1950 (Reference 1). The Sea-level Pressure and Anomaly map for August depicts a pattern fairly similar to the 500-hPa height anomaly pattern for August, and also shows the stronger SLP anomalies generally poleward of 50N Figure 8.
The Tropics
In July, SST anomalies remained above-average across the equatorial Pacific Ocean. All of the Nino-region SST indices were between +0.6C to +1.0C throughout the month. The oceanic thermocline along the equator remained deeper than average across the equatorial Pacific. In addition, convection was suppressed over Indonesia and enhanced across the western Pacific and near the Date Line. This coupling of the oceanic and atmospheric anomalies reflects El Nino conditions
SST anomalies remained aboveaverage across the equatorial Pacific during August 2009. Consequently, all of the Nino-region SST indices were between +0.8C and +1.0C throughout the month. Convection was suppressed across Indonesia and the western Pacific. These factors, among others, are supportive of a weak El Nino. The tropical circulation also featured intra-seasonal activity associated with the Madden-Julian Oscillation (MJO), which masked the El Nino-related pattern of enhanced convection over the central equatorial Pacific. Th e MJO also produced a westerly wind burst in the western tropical Pacific early in the month, which triggered an eastward propagating oceanic Kelvin wave. This wave contributed to a deepening of the oceanic thermocline during the month, and to an increase in oceanic heat content in the central equatorial Pacific.
Tropical storm activity in August ramped up quickly in both the Atlantic and eastern Pacific basins, after a slow start to the 2009 season. Major Hurricane Bill was a classic Cape Verde storm, with maximum winds of 215 km/hr (135 mph), that fortunately stayed well off the East Coast of the United States.
References

Back to top