Marine Weather Review-North Pacific Area September through December 2004
By George P. Bancroft, NOAA National Center for Environmental PredictionIntroduction
This period includes the fall season when western North Pacific tropical cyclones were relatively active. Most of these passed near, over or south of Japan prior to becoming extratropical or dissipating. Only one of them appeared after October.
Extratropical storm activity picked up late in October, and the November to December period was particularly active, with hurricane-force storms concentrated during those months. Due to the sheer number of storms, the focus in this article is on hurricane-force storms, labeled as such by OPC surface analysts on the basis of QuikScat and other satellite imagery, surface observations, model guidance and trends.
Tropical Activity
|
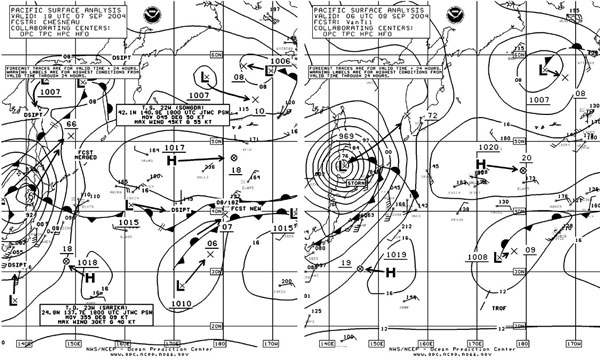
Figure 1. OPC North Pacific Surface Analysis charts (Part 2) valid 1800 UTC September 7 and 0600 UTC September 8, 2004. Tropical Storm Songda is depicted becoming an extratropical storm. |
Typhoon Songda: At the start of September, Typhoon Songda was near 18N 146E with maximum sustained winds of 125 kts with gusts to 150 kts. It maintained intensities in the range of 105 to 125 kts sustained winds through September 3, when the typhoon passed about 700 nmi south of Japan. While the typhoon was making the turn to the north out near 130E from September 3 through early on the 5th, several ships reported near the path of the storm and are included in a list of ship reports in Table 1. Songda then turned northeast into the Sea of Japan and re-appeared on The Ocean Prediction Center's (OPC's) radiofacsimile analysis charts near 39N 136E at 1200 UTC September 7 with maximum sustained winds of 70 kts with gusts to 85 kts. It weakened to a tropical storm six hours later. Figure 1 shows Songda merging with a non-tropical low and frontal system in the Sea of Japan and re-intensifying as an extratropical storm over a twelve hour period. Songda was most intense as an extratropical storm at 1200 UTC on the 8th when the central pressure was 967 hPa. The cyclone then began to weaken as it passed through the Sea of Okhotsk and later turned east into the Bering Sea on September 9 as a gale. Late on the 11th, the system entered the southern Gulf of Alaska while continuing to weaken before moving inland late on September 13.
| OBSERVATION | POSITION | DATE/TIME (UTC) | WIND (kts) | SEAS (m/ft) |
| Northwest Sandpiper
(VNVG) |
25N 130E
27N 131E |
03/1200
04/0000 |
NW 75
NE 90 |
9.5/31 |
| Bishu Maru (JGAC) | 25N 133E | 04/0000 | E 65 | 8.5/28 |
| Bishu Maru (JGAC) | 25N 133E | 04/0900 | SE 50 | 12.5/41 |
| Mokihana (WNRD) | 26N 134E | 04/1800 | SE 45 | 9.5/31 |
| Bishu Maru (JGAC) | 24N 133E | 04/2100 | S 55 | 10.4/34 |
| Mokihana (WNRD) | 29N 133E | 05/0600 | E 35 | 9.0/30 |
| LNG Leo (V7BX2) | 29N 130E | 05/0900 | E 65 | 6.5/21 |
| LNG Leo (V7BX2) | 28N 130E | 05/1200 | NE 55 | 10.7/35 |
| LNG Leo (V7BX2) | 27N 130E | 06/0800 | S 55 | |
| Leverkusen Express (DEHY) | 31N 134E | 06/1800 | S 50 | |
| Mignon (SJCD) | 33N 134E | 07/0000 | S 35 | 9.0/30 |
| Name Unknown (9MXFC) | 32N 136E | 07/0600 | S 45 | |
| Name Unknown (JHQP) | 45N 148E | 08/0600 | S 45 |
Table 1. Some ship observations taken during passage of Tropical Cyclone Songda including one taken after Songda became extratropical Name Unknown (JHQP).
Tropical Storm Sarika: Tropical Depression 23W formed near 17N 150E at 1800 UTC September 4, became Tropical Storm Sarika six hours later while moving northwest, and then intensified to just short of typhoon intensity near 20N 140E at 1200 UTC September 6. Maximum sustained winds reached 60 kts along with gusts to 75 kts. Sarika then began weakening and turned north toward Japan, but dissipated late on the 7th. The first part of Figure 1 shows dissipating Tropical Depression Sarika 600 nmi south of Japan.Typhoon Meari: Meari entered OPC's oceanic analysis area about 1,100 nmi south of Tokyo early on September 22 as a minimal typhoon with maximum winds 65 kts with gusts to 80 kts. By 1800 UTC on the 23rd, Meari developed maximum sustained winds of 105 kts with gusts to 130 kts near 19N 135E and turned more westward, passing west of OPC's analysis area on the 24th.
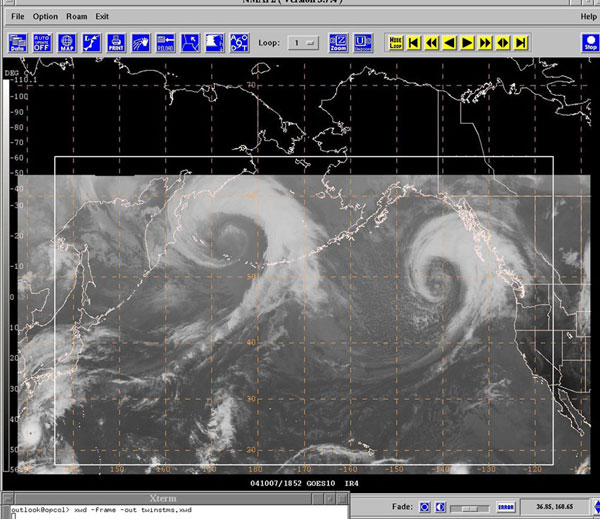
Typhoon Ma-On: With maximum sustained winds of 125 kts with gusts to 150 kts, as of 1800 UTC October 7, Typhoon Ma-On appears near the lower left corner of the satellite image of Figure 3 with a well-defined eye. The cyclone tracked northeast and weakened, passing near Tokyo at 0600 UTC October 9 with maximum winds 90 Kt with gusts to 110 kts. The Yahagi Maru (JPAZ) reported northeast winds of 45 kts and 10.0 m seas (32 ft) near 33N 136E at 0600 UTC October 8. The cyclone then weakened rapidly over cooler water and dissipated after crossing 40N by 0000 UTC on the 10th.
Typhoon Tokage: Tropical Storm Tokage was named south of OPC's radiofacsimile chart area, well south of Japan, late on October 12 and tracked northwest, passing across 16N 135E at 1800 UTC on the 15th as a typhoon with maximum sustained winds 100 kts with gusts to 125 kts. Tokage then recurved toward Japan, weakening to a tropical storm near 31N 132E at 0000 UTC October 20 with maximum winds 60 kts with gusts to 75 kts.
By 1200 UTC that day Tokage was over Japan's main island of Honshu near 36N 137E with maximum sustained winds 40 kts with gusts to 50 kts. The weakening tropical storm produced some impressive seas south of Japan as indicated in Table 2. Tokage then crossed northern Honshu as a tropical depression before becoming an extratropical storm near 43N 154E by 1200 UTC on the 21st. After reaching the central Bering Sea late on October 22, the remains of Tokage re-intensified near the southwest mainland Alaska coast early on the 23rd with central pressure down to 972 hPa. Then, the storm reformed in the northern Gulf of Alaska early on the 24th, before dropping southeast to the Oregon coast of the U.S. on October 26, where it weakened. During the extratropical phase of Tokage's existence the strongest wind reported by a ship was a south wind of 55 kts from Westwood Victoria (C6SI6) near 41N 163E at 0000 UTC October 22.
| OBSERVATION | POSITION | DATE/TIME (UTC) | WIND (kts) | SEAS (m/ft) |
| Paris Express (DIHE) | 31N 135E | 20/0000 | SE 50 | 8.2/27 |
| Paris Express (DIHE) | 30N 135E | 20/0300 | S 55 | 13.5/44 |
| Paris Express (DIHE) | 30N 135E | 20/0600 | SW 50 | 17.0/56 |
| LNG Leo (V7BX2) | 32N 138E | 20/1200 | S 50 | 10.7/35 |
| Gallina (9VGC4) | 34N 138E | 20/1200 | SW 60 | 11.5/38 |
| Mare Internum (V2CP) | 38N 152E | 20/1800 | S 35 | 8.5/28 |
| LNG Leo (V7BX2) | 33N 137E | 20/1800 | W 50 | |
| Oriente Shine (H9AL) | 35N 145E | 21/0000 | S 40 | 6.7/22 |
| Buoy 21600 | 34.6N 137.9E | 20/1500 | 10.7/35 |
Table 2. Ship and buoy observations taken during passage of Tropical Cyclone Tokage.
Typhoon Nock-Ten: Typhoon Nock-Ten made a brief appearance on the OPC North Pacific surface analysis near 16N 135E at 1200 UTC October 22 while on a northwestward track west of the area. Maximum sustained winds were 100 kts with gusts to 125 kts.
Tropical Storm Noru: The last tropical cyclone of the period moved into OPC's North Pacific chart area as Noru, near 16N 146E at 1800 UTC December 19 with maximum sustained winds of 50 kts with gusts to 65 kts. Unlike any of the other tropical systems of the four-month period through December, Noru moved first northeast and then turned east, and became an extratropical gale near 27N 167E by the 22nd, briefly a storm late on the 23rd near 26N 175W, and then turned more north near 170W. Noru later redeveloped as a storm in the Gulf of Alaska on December 28 before dropping southeast and weakening over the U.S. Pacific Northwest on the 31st.
Other Significant Events
|
Figure 2. OPC North Pacific Surface Analysis charts (Parts 1 and 2) valid 1800 UTC October 7, 2004. Twin hurricane-force storms are shown near maximum intensity. |
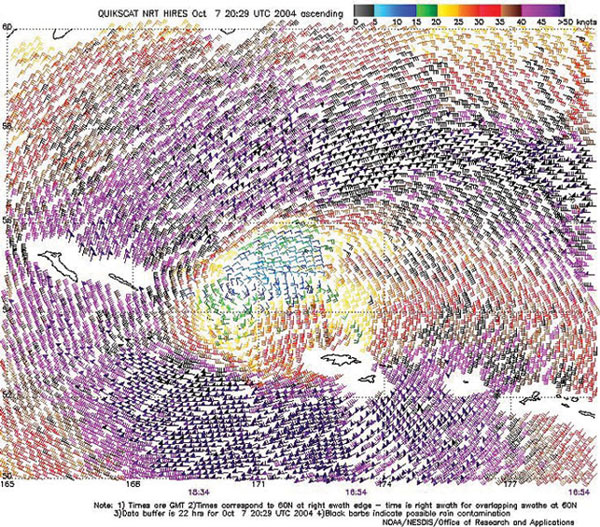
Twin Hurricane-Force Storms, October 6-9: These were the first non-tropical hurricane-force storms of the period, occurring simultaneously. The eastern system rapidly intensified from a 1008 hPa low near 43N 169W to a 962 hPa hurricane-force storm near 48N 143W in the twenty-four hour period ending at 1200 UTC October 7-a drop of 46 hPa (almost 2 hPa per hour). OPC classified it as hurricane force from 0600 UTC on the 7th through 0000 UTC on the 8th. The lowest central pressure was 957 hPa at 1800 UTC on the 7th when the center was at 49N 141W. The cyclone weakened rapidly beginning later on the 8th while drifting northeast and dissipated near the coast of British Columbia late on the 9th. The western system developed from a 993 hPa low near 40N 148E at 0600 UTC October 6 which moved northeast. The central pressure dropped 28 hPa in the twenty-four hour period ending at 1200 UTC on the 7th, when the cyclone became a hurricane-force storm near 53N 168E with the center at 962 hPa. The central pressure was as low as 955 hPa when the center was in the Bering Sea near 57N 179W at 1800 UTC October 8. The low was labeled as hurricane-force by OPC from 1200 UTC on the 7th through 0600 UTC on the 8th. Weakening followed, with the system becoming a gale in the eastern Bering Sea late on the 9th, and then becoming absorbed by another large gale to the south on the 11th. Figure 2 shows the two storms fully developed. Figure 3 is a satellite image valid shortly thereafter, featuring frontal cloud bands wrapping around well-defined centers, broad comma-like cloud features and high (cold) cloud tops. The valid time of the QuikScat image of Figure 4 is close to that of Figure 2, and shows swaths of 50 to 65 kts wind barbs on the south side of the center and also to the north, and even some 70 kts observations to the northeast. Similar data was available for the eastern system (not shown) and showed similar winds around the south and southwest sides of the center. Table 3 lists some ship and buoy observations around the two storms.
|
|
| OBSERVATION | POSITION | DATE/TIME (UTC) | WIND (kts) | SEAS (m/ft) |
| Horizon Enterprise (KRGB) | 49N 145W | 07/1200 | N 60 | |
| Horizon Enterprise (KRGB) | 47N 137W | 08/0400 | SW 55 | |
| Horizon Anchorage (KGTX) | 50N 129W | 08/0100 | SE 40 | 9.0/30 |
| Horizon Anchorage (KGTX) | 52N 133W | 08/1200 | S 45 | 10.5/34 |
| Buoy 46004 | 51N 136W | 08/0200 | S 35 | 10.0/32 |
| Buoy 46036 | 48N 134W | 08/0200 | SW 35 | 8.5/28 |
| Pilsum (A8DO8) | 48N 158E | 07/0000 | NW 60 | |
| President Adams (WRYW) | 49N 176W | 07/1800 | S 40 | 9.5/31 |
| Swift Arrow (C6NI7) | 52N 178W | 08/0600 | SW 50 | |
| Swift Arrow (C6NI7) | 51N 180W | 09/0000 | W 50 | |
| Buoy 46035 | 57N 177W | 07/2200 | SE 45 | 5.0/16 |
| Buoy 46035 | 57N 177W | 08/0000 | SE 35 | 5.2/17 |
| Buoy 46071 | 51N 179E | 08/0700 | SW 50 |
Table 3. Ship and buoy observations taken around the two storms of October 6-9.
Northwestern Pacific and Bering Sea Storm of November 15-19: This system moved east from Sakhalin Island already with a 972 hPa center at 1200 UTC on November 15 and intensified to 956 hPa twenty-four hours later when the center was at 52N 154E. The low was briefly classified by OPC as a hurricane-force storm from 0000 to 0600 UTC on the 16th. At 1200 UTC November 16, the ships Hanjin Praha (A8CP5) (49N 155E) and Zim Italia (4XGT) (52N 159E) both reported southwest winds of 55 kts. Six hours later, Hanjin Praha (A8CP5) reported a west wind of 55 kts at 48N 153E. The storm entered the Bering Sea early on the 17th and slowly weakened. It was absorbed by another storm coming into the eastern Bering Sea from the south on the 19th.
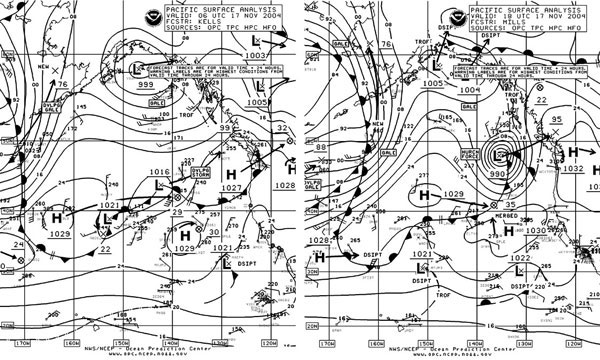
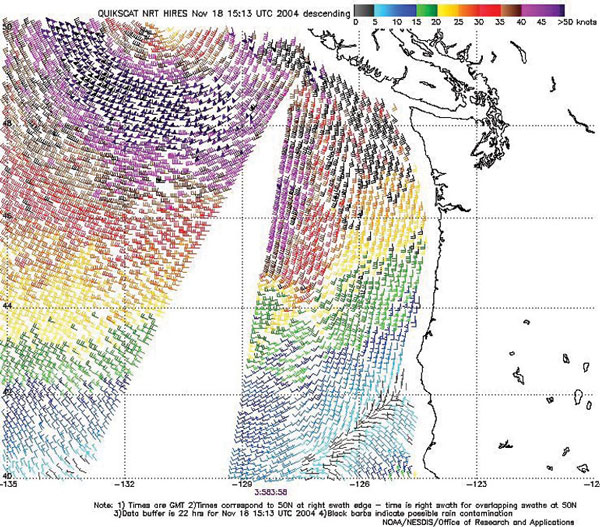
Eastern North Pacific Storm of November 17-18: This hurricane-force storm developed rapidly from a frontal wave of low pressure, as depicted in Figure 5. The system deepened 26 hPa in only 12 hours, resulting in the compact hurricane-force storm, shown in the second part of Figure 5. The low was deepest at that time with the center at 990 hPa. The Horizon Kodiak (KGTZ) encountered northeast winds of 55 kts near 51N 130W at 0600 UTC November 17. The high-resolution QuikScat image in Figure 6 reveals a swath of west to northwest winds in the 50 to 65 kts range around the southwest side of the storm center, which is just off the chart at 50N 131W. The storm quickly moved inland and weakened on the 18th. This was followed by a similar storm at the end of the month, described in the next section.
|
|
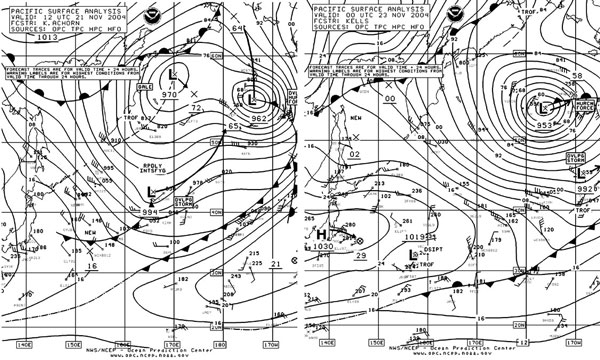
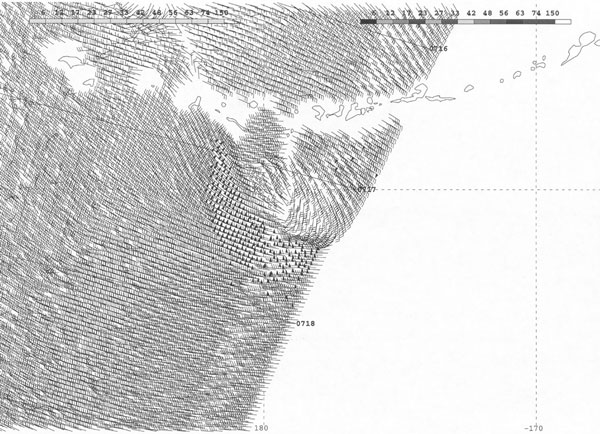
North Pacific and Bering Sea Storms, November 20-25: The first of two storms described here followed a preceding storm (on the 19th) into the eastern Bering Sea on November 21 (the 962 hPa low in the first part of Figure 7). It came from south of the Kamchatka Peninsula late on the 19th, initially deepening by 24 hPa in the twenty-four hour period ending at 0600 UTC on the 21st. The central pressure bottomed out at 954 hPa when the center was at 57N 171W at 1800 UTC November 21. The Zim U.S.A. (4XFO) reported a south wind of 80 kts near Dutch Harbor at 1200 UTC on the 21st (Figure 7). Other reports from ships and buoys for this storm and the one to follow are shown in Table 4. The storm center then moved north of the Bering Sea on the 22nd. The development of the second storm to follow is shown in Figure 7, with the center developing a lowest pressure of 953 hPa in the southern Bering Sea, where the system slowed. The central pressure fell 41 hPa in the thirty-six hours ending at 0000 UTC November 23. There were no ship or buoy observations with hurricane-force winds with this storm, but the QuikScat image in Figure 8 reveals winds to 65 kts on the southwest side of the center, still just southwest of the central Aleutians at that time. The storm then moved slowly northeast and weakened to a gale early on the 24th, before weakening over Alaska by the 25th.
|
|
| OBSERVATION | POSITION | DATE/TIME (UTC) | WIND (kts) | SEAS (m/ft) |
| Levant Weser (V2AC6) | 55N 168W | 21/1200 | S 52 | |
| Levant Weser (V2AC6) | 55N 169W | 21/1800 | SW 60 | |
| Signet Courageous (WDB7918) | 59N 174W | 22/0200 | W 65 | |
| Buoy 46072 | 51.6N 172.2W | 21/0900 | SW 43 | G64 8.5/28 |
| Buoy 46072 | 51.6N 172.2W | 21/1200 | SW 40 | 9.0/30 |
| SeaLand Explorer (WGJF) | 44N 178W | 22/0600 | SW 35 | 10.7/35 |
| Polar Eagle (ELPT3) | 54N 174W
54N 173W |
22/1500
22/1700 |
SE 50
SE 55 |
|
| Buoy 46072 | 51.6N 172.2W | 22/1900 | S 35 | 9.5/31 |
| Buoy 46071 | 51N 179E | 22/1300 | NW 40 | 6.0/20 |
Table 4. Selected ship and buoy observations taken in the two storms of November 20-25.
|
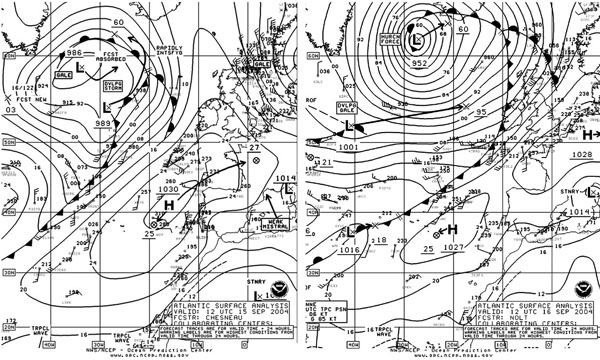
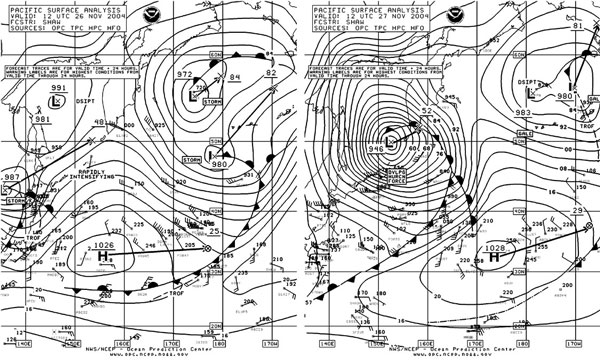
Figure 9. OPC North Pacific Surface Analysis charts (Part 2) valid 1200 UTC November 26 and 27, 2004. |
Western North Pacific Storm of November 26-29: Initially a storm when entering the Sea of Japan, this system deepened explosively in the following twenty-four hour period as shown in Figure 9, resulting in the deepest storm of the period in both oceans (946 hPa or 27.94 in). The pressure drop in twenty-four hours was an impressive 41 hPa. At 0000 UTC on the 28th the Swift Arrow (C6NI7) near 48N 158E reported west winds of 65 kts. Six hours later the Santa Giuliana (ELYR2) experienced northwest winds of 60 kts and 15.0 m seas (49 ft). The storm subsequently began to weaken while moving into the Bering Sea later on the 28th, where it weakened further to gale strength by November 30.
Eastern North Pacific Storm, December 28-29: This storm's strength and motion were similar to the November 17-18 event, except a bit farther north. The center deepened by 14 hPa while moving from 48N 143W to 53N 137W in the twelve hour period ending at 0600 UTC November 29. The lowest central pressure was 994 hPa when the center was at 53N 137W at 0600 UTC on the 29th. Like the November 17-18 storm, this storm was compact with QuikScat winds similar to the data found in Figure 6. The ship Polar California (WMCV) near 51N 135W reported a northwest wind of 50 kts at 1800 UTC November 29. The Canadian buoy 46004 (50.9N 136.1W) at 0800 UTC on the 29th reported a maximum wind of 41 kts with gusts to 54 kts, from the west, and 7.5 m seas ( 25 ft). Maximum seas were 8.5 m (28 ft) three hours later, at this buoy. The Canadian buoy 46208 (52.5N 132.7W) reported southeast winds up to 35 kts and gusts to 49 kts along with seas 4.5 m (15 ft) at 0700 UTC November 29. Maximum seas were 8.0 m (26 ft) at 1200 UTC on the 29th. The storm weakened near the coast late on the 29th.
North Pacific Storm, December 1-2: This system formed well south of the western Aleutians late on November 30 and moved rapidly northeast. It became deepest near 50N 166W with the central pressure at 970 hPa at 0000 UTC December 2, after dropping 26 hPa in twenty-four hours. OPC labeled it as a hurricane-force storm for a twenty-four hour period beginning at 1800 UTC on the 1st. QuikScat winds revealed 65 kts wind barbs southwest of the center, similar to Figure 8. The ship Cap Delgado (A8BF9) (45N 157W) encountered southwest winds of 45 kts and 7.6 m seas (25 ft) at 0600 UTC December 6. The NOAA buoy 46066 (53N 155W) reported a west wind of 40 kts and 12.0 m seas (39 ft) at 1600 UTC December 2. The storm then weakened near the Alaskan coast by the 4th.
|
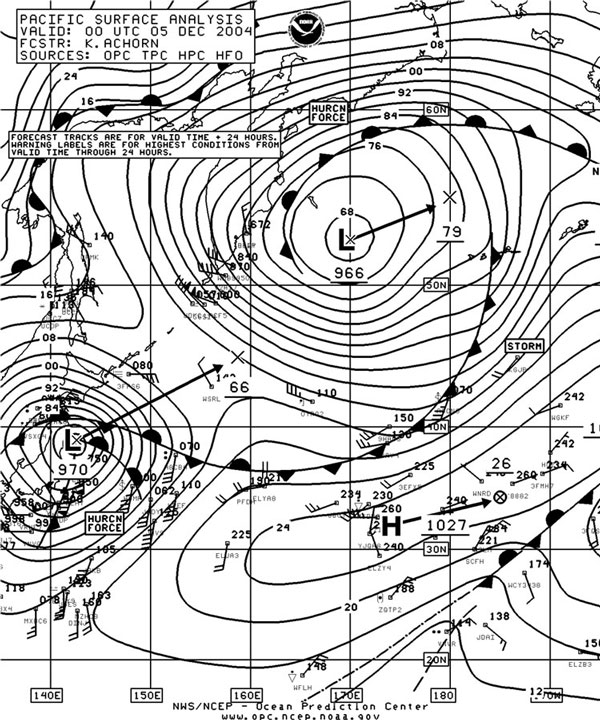
Figure 10. OPC North Pacific Surface Analysis chart (Part 2) valid 0000 UTC December 5, 2004. |
Western North Pacific Storm, December 3-5: A complex low-pressure system developed just southeast of the Kurile Islands on December 2 and drifted northeast while intensifying, leading to a hurricane-force low in the southwest Bering Sea as shown in Figure 10. The system was deepest at that time, and the hurricane-force winds occurred in the northeast flow north of the occluded front, in the northern Bering Sea, as revealed by QuikScat data. The highest winds reported by ships in this storm were up to 55 kts south of the Kamchatka Peninsula as shown in Figure 10. The system subsequently weakened near the Alaskan coast on December 6.
North Pacific Storm of December 4-8: Figure 10 shows this storm just after it moved out of the Sea of Japan, already with a 970 hPa central pressure and hurricane-force winds, as revealed by ship reports. The Leverkusen Express (DEHY) reported a southwest wind of 80 kts near 35N 142E at 0000 UTC December 5. The Polar Eagle (ELPT3) encountered south winds of 70 kts near 37N 143E at that time. Also Puteri Intan Satu (9MET6) (34N 141E) experienced southwest winds of 60 kts. Six hours later, the ship Daishin Maru (3FPS6) near 43N 146W reported east winds of 65 kts. The storm maintained hurricane-force winds through 0000 UTC December 6 while tracking northeast. The system, after some weakening by the 6th, strengthened to 953 hPa by the 8th to become a large storm covering much of the area east of the dateline. The center then turned north and dissipated near southern mainland Alaska late on the 10th.
|
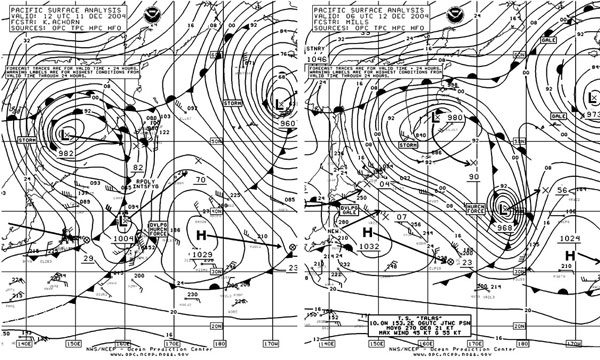
Figure 11. OPC North Pacific Surface Analysis charts (Part 2) valid 1200 UTC December 11 and 0600 UTC December 12, 2004. |
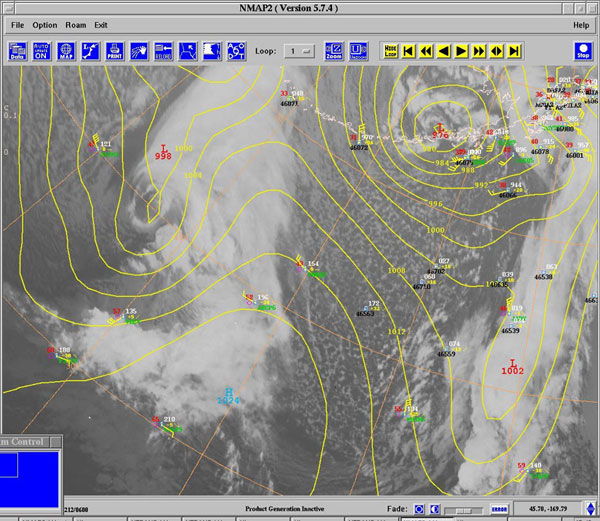
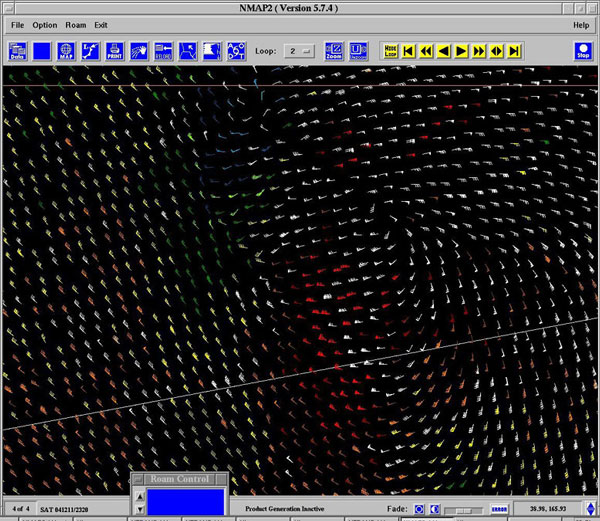
North Pacific Storm, December 11-14: Figure 11 displays the rapid spinup of this compact and potent storm over only an eighteen hour period when much of the intensification occurred. The central pressure dropped 36 hPa during this period. The satellite image in Figure 12 matches the second part of Figure 11 when the center was near maximum intensity. The numbered lines on the image are model pressure forecasts which appear to not capture this rapid initial deepening. An eye-like cloud formation appears at the center suggesting a very intense low. A ship, the San Clemente (ELVB3) reported at 2100 UTC December 11 (halfway between the two analysis times in Figure 11) with a south wind of 70 kts and a pressure of 972 hPa. A high-resolution QuikScat pass (Figure 13) shows several 95 kts wind barbs as west to southwest winds in the lower left portion of the image. Some are rain-flagged (in white) and others are not. The author has looked at QuikScat data since 1999 and has never seen 95 kts winds in QuikScat images. The storm maintained hurricane-force winds through 1800 UTC on the 13th and the lowest central pressure was 963 hPa at 0000 UTC on the 13th, near 45N 177W. At 0000 UTC December 14, Providence Bay (MSTM6) (36N 173W) reported a west wind of 55 kts. The system weakened to a gale near 44N 163W on the 14th and then turned north and weakened over southwest Alaska by the 16th. A secondary storm formed to the east by the 16th and briefly developed hurricane-force winds with a 971 hPa center in the northeast Gulf of Alaska at 1800 UTC December 16 before moving inland shortly thereafter.
|
|
Western North Pacific Storm, December 17-20: This storm originated near Japan late on December 15 and moved east between 41N and 44N. Much of the initial intensification was in the twenty-four hour period ending at 0600 UTC on the 17th, when the pressure dropped 24 hPa. The storm was labeled as hurricane force by OPC from 1200 to 1800 UTC on the 17th, with the center developing a lowest pressure of 972 hPa near 43N 159E at the latter time. At 1800 UTC December 17 the vessel Providence Bay (MSTM6) reported a west wind of 65 kts at 39N 159E. The system continued to track east and weakened to a gale by the 22nd and then re-formed to the north and moved into Alaska late on the 22nd.
|
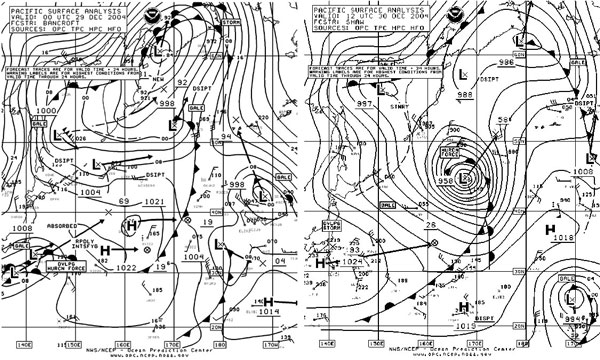
Figure 14. OPC North Pacific Surface Analysis charts (Part 2) valid 0000 UTC December 29 and 1200 UTC December 30, 2004. |
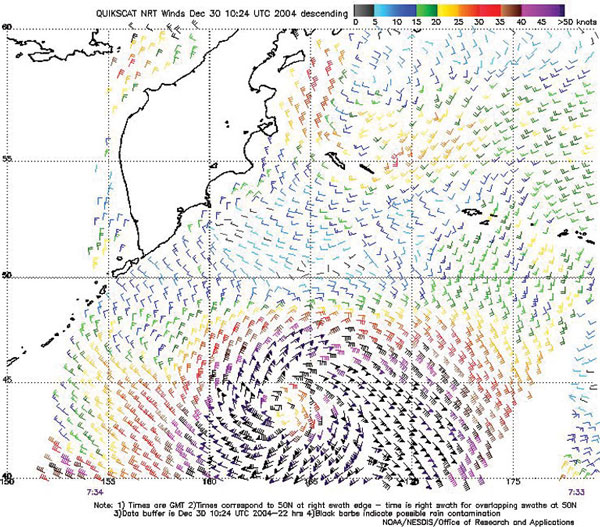
Western North Pacific Storm, December 29-31: A complex frontal wave of low pressure south of Japan at 0000 UTC December 29 rapidly intensified while moving northeast, with the central pressure dropping 38 hPa in the first twenty-four hours. The low developed hurricane-force winds by 0000 UTC December 30 which persisted to the end of the month. Figure 14 shows a relatively compact storm system (958 hPa) at 1200 UTC on the 30th, and the corresponding infrared satellite image (Figure 15) reveals a broad comma-type cloud formation with cold tops, a well-defined center and higher clouds wrapping around the center. Cold-air cumulus-type clouds appear south of the center. The QuikScat image of Figure 16 valid several hours prior to the second part of Figure 14 reveals numerous 60 to 80 kts wind observations in the south semicircle of the center with even one 90 kts wind barb southwest of the center. The center deepened further to 951 hPa near 48N 172E at 0000 UTC on the 31st, making it the second deepest of the September-to-December period. The ship OOCL New York (DPAK) (41N 170E) reported northwest winds of 45 kts and 12.0 m seas (39 ft) at 0900 UTC December 31. The President Adams (WRYW) encountered northwest winds of 50 kts and 9.0 m seas (30 ft) near 50N 160E at 0600 UTC on the 31st. The buoy 46071 (51N 179E) reported a south wind of 30 kts and 12.2 m seas (40 ft) at 1600 UTC December 31. The storm continued on a northeastward track and began to weaken through the end of the month.
|
|

Acknowledgment
The author wishes to recognize the contribution of Donald S. Prosise of OPC who saved satellite information on the December 12 storm in the western North Pacific while the author was on leave.
Page last modified: