Marine Weather Review-North Atlantic Area September through December 2004
By George P. Bancroft, NOAA National Center for Environmental PredictionIntroduction
Tropical activity was concentrated during the period from September to early October, which includes what is normally the peak of the hurricane season, early September. All but one of the tropical cyclones to move over the Ocean Prediction Center's (OPC's) marine area occurred during this period and included two hurricanes (Karl and Lisa, which remained far from land) and one subtropical storm. The other, the late-season storm Otto, also remained in the open Atlantic.
Most of the significant developments of low-pressure systems during this period were after the middle of October and most tracked in a northeastward direction from the Canadian Maritime Provinces or U.S. East Coast and passed near or north of the British Isles. The most active period was late November through December as the season was progressing into winter.
Tropical Activity
Tropical Storm Gaston: See December issue of MWL for more information of Gaston as a tropical storm. Gaston became an extratropical gale south of the island of Newfoundland early on September 1, and then continued moving off to the east-northeast and dissipated just west of Ireland on September 3.
Tropical Storm Frances: After moving into central Florida as a hurricane on the night of September 4, Frances weakened to a tropical storm over northwest Florida by September 6, with effects extending into the far southwest portion of OPC's offshore waters. The ship Nordon (PBHU) encountered southeast winds of 35 kts near 32N 79W at 1800 UTC September 6, and similar conditions six hours later at 32N 80W. Frances weakened to a tropical depression inland over the southeast U.S. early on September 7, before becoming extratropical inland over the middle Atlantic states late on the 8th. After crossing the Canadian Maritime Provinces during the following two days, the remains of Frances dissipated east of Newfoundland on the 11th.
Tropical Depression Ten: This cyclone was short-lived, forming from a weak low pressure area about 300 nmi southwest of the Azores early on September 9 and drifting northeast. Maximum sustained winds were 30 kts and gusts were up to 40 kts. The cyclone then dissipated as a remnant low on the night of September 9.
Tropical Depression Ivan: Formerly a major hurricane in the Gulf of Mexico, Ivan weakened to a depression inland over the southeast U.S. on September 17, before becoming an extratropical gale over the middle Atlantic states on the night of September 17. The ships Sealand Pride (WDA3673) (33N 77W) and Nordon (PBHU) (32N 78W) reported south winds of 35 kts at 0000 UTC September 18. Ivan's remains then turned east and then south off the U.S. middle Atlantic coast later on September 18, before moving south of 31N on the night of September 19.
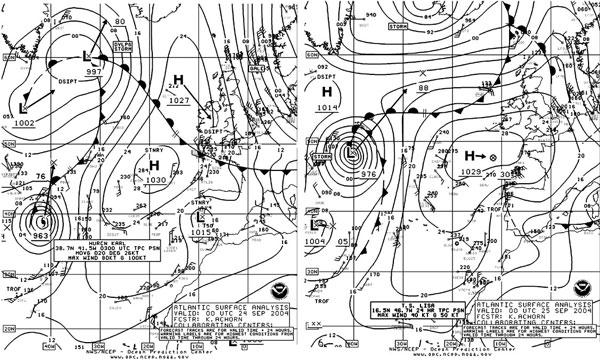 |
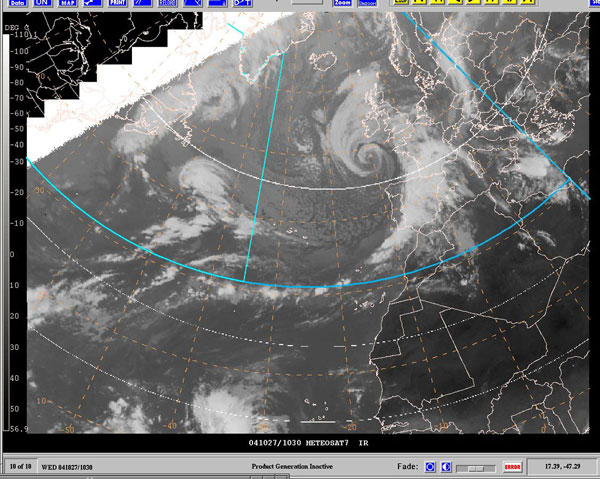
Figure 1. OPC North Atlantic Surface Analysis charts (Part 1 - east) valid 0000 UTC September 24 and 25, 2004, showing Hurricane Karl becoming an extratropical storm. |
Hurricane Karl: Karl moved north into OPC's high seas waters to near 32N 46W early on September 23 with maximum sustained winds of 110 kts and gusts to 135 kts, the strongest hurricane to affect OPC's marine area during the 2004 Atlantic hurricane season and slightly stronger than Alex in early August. At 1200 UTC September 23 the ship Star Herdla (LAVD4) reported a southeast wind of 40 kts at 31N 41W. Karl continued to move north and approached a frontal zone to the north while weakening through the 24th, but remained a hurricane until being declared extratropical late on September 24. Figure 1 shows the transformation of Karl to an extratropical storm-force low with a 976 hPa central pressure over a twenty-four hour period ending at 0000 UTC September 25. The cyclone then moved northeast and passed southeast of Iceland with little change in intensity on the 26th. The vessel Arnafell (MYCP9) near 62N 5W encountered west winds of 55 kts at 1800 UTC on September 26.
Tropical Depression Jeanne: While Hurricane Jeanne made a loop south of OPC's marine area and east of the Bahamas, the ship Horizon Hawaii (KIRF) reported a north wind of 40 kts on the outer fringe of Jeanne near 31N 69W at 0000 UTC September 23. Jeanne crossed central Florida on September 26 before turning northeast and weakening to a tropical depression inland over the southeast U.S. early on the 28th. At 1200 UTC September 28 the ship OOCL Faith (VRWG6) encountered south winds of 35 kts at 34N 76W near the North Carolina coast. After becoming an extratropical gale near the Delmarva Peninsula late on the 28th, the cyclone turned more east along 41N and passed south of Newfoundland on October 1, before turning more southeast and dissipating near the Azores early on October 6.
Hurricane Lisa: Lisa initially followed closely the track of Karl and entered the southeast high seas waters of OPC at the end of September as a tropical storm, then strengthened into a hurricane near 38N 45W at 2100 UTC October 1 with maximum sustained winds of 65 kts with gusts to 80 kts. Lisa then weakened to a tropical storm near 43N 35W late on October 2 and veered to the right of the track of Karl. Lisa then weakened to an extratropical gale near 45N 30W at 0600 UTC October 3, crossed the British Isles on the night of the 3rd, and then re-intensified into a large storm north of the British Isles after absorbing another low near Iceland on the 4th. The center developed a central pressure down to 968 hPa near 62N 8W at 1800 UTC on the 4th. The ship Arina Arctica (OVYA2) reported a north wind of 60 kts near 61N 13W at 1200 UTC on the 5th. The storm then weakened and moved east, passing south of Norway late on the 7th.
Subtropical Storm Nicole: Nicole developed from a non-tropical low near 32N 66W early on October 10. Maximum sustained winds were 40 kts with gusts to 50 kts. A subtropical storm has characteristics of both tropical and non-tropical lows, and maximum sustained winds of 34 kts or higher. Nicole then accelerated northward and slowly strengthened, with maximum sustained winds reaching 45 kts with gusts to 55 kts when the center crossed 40N 61W at 2100 UTC October 11. Near this time the Teco Trader (KSDF) (near 35N 61W) reported a south wind of 45 kts and 6.5 m seas (21 ft) at 1200 UTC October 11, and six hours later the Ville de Libra (DNFA) (near 41N 56W) encountered southeast winds of 43 kts and 8.0 m seas (26 ft). The cyclone then merged with a polar front to the west and became an extratropical storm near 42N 63W late on the 11th. The Ville de Libre (DNFA) reported west winds of 40 kts and 8.5 m seas (28 ft) near 1800 UTC on the 12th. The highest wind reported from a ship was a 52 kts north wind from the vessel Don Carlos (SICN) near 41N 66W at 0000 UTC October 12. The Gulf of Maine buoy 44024 (42.3N 65.9W) reported a northwest wind of 37 kts and gusts to 49 kts along with 7.5 m seas (25 ft) at 0700 UTC October 12, the highest winds and seas reported from a buoy. The buoy Canadian 44142 (42.5N 64.0W) had a lowest pressure of 972.4 hPa at 1300 UTC on the 12th. The cyclone then moved north across the Canadian Maritimes as a gale on the 13th and reached the northern Labrador Sea on the 14th, before turning southeast and weakening on the 16th.
Tropical Storm Otto: Otto was the last tropical cyclone of the 2004 season, a late-season storm developing from a non-tropical system which moved north into OPC's high seas waters and stalled near 32N 51W, becoming a tropical storm late on November 30. Otto developed a maximum intensity of 45 kts sustained winds and gusts to 55 kts at 0900 UTC December before drifting southeast and beginning to weaken. The ship Sabine (V7BI3) (32N 53W) reported a northwest wind of 50 kts at 0600 UTC December 1. Otto moved south of 31N early on December 2 and weakened to an extratropical low later on the 2nd. Otto's remnant low appears in Figure 6 near 26N 50W at 1800 UTC December 3.
Other Significant Events of the Period
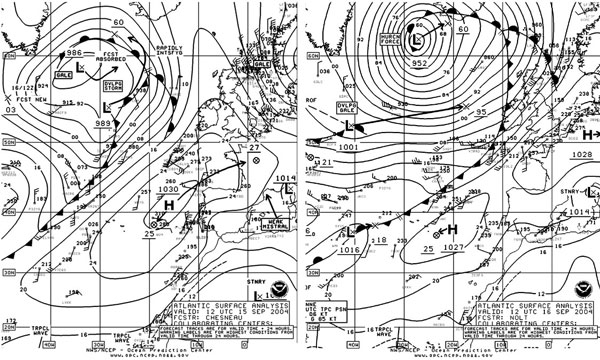
North Atlantic Storm, September 15-17: A complex area of low pressure developed over the Canadian maritime provinces early on September 13 and moved northeast, passing south of Greenland on the 14th. The system formed a new center on a front west of Ireland as shown in Figure 2, which moved north and rapidly intensified, absorbing the gale center to the northwest. The second part of Figure 2 shows a mature hurricane-force low southwest of Iceland at maximum intensity. Although it was still late summer on the calendar, the storm developed a central pressure of 952 hPa, which was the second lowest of the period in the North Atlantic for non-tropical systems and comparable to the October 16-18 storm below, in terms of intensity. The storm then moved northeast past Iceland late on the 18th.
|
|
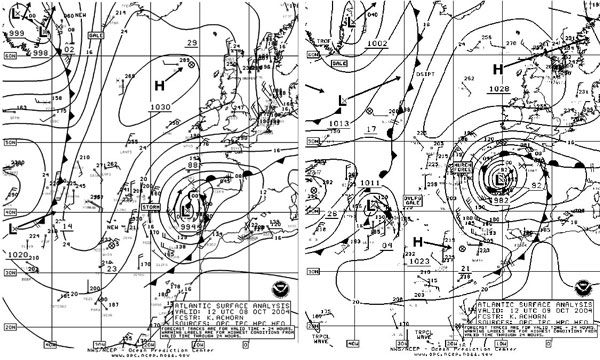
Storm near Europe, October 8-10: This slow-moving system formed west of Portugal early on October 8 and drifted north, blocked by high pressure to the north. The second part of Figure 3 shows the storm at maximum intensity with hurricane-force winds. At 1200 UTC October 9 the Punjab Senator (DQVK) (near 44N 9W) encountered south winds of 65 kts, and the Bretagne (FNBR) near 51N 5W reported east winds of 55 kts. At the same time the ship LNG Bayelsa (ZCDF9) near 42N 10W reported southwest winds of 50 kts and 9.0 m seas (29 ft). The storm then drifted northeast and weakened over France on the 11th.
|
|
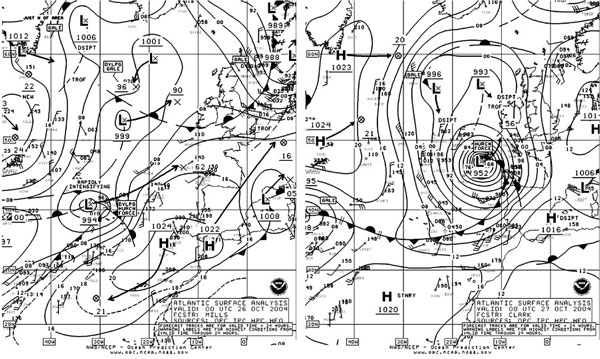
Eastern North Atlantic Storm of October 26-28: This storm had origins near the mid-Atlantic coast of the U.S. early on October 20. Figure 4 shows this low off the left edge of the first part of the figure, but developing a secondary center near 41N 32W which tracked northeast while rapidly deepening. This was truly a meteorological "bomb," dropping 42 hPa in central pressure in the 24-hour period covered by Figure 4. The central pressure bottomed out six hours later at 950 hPa at 0600 UTC on October 27, making the storm the deepest of the four-month period in the North Atlantic among non-tropical lows. Figure 5 is a satellite image of the storm as it appeared four and one-half hours later, fully mature with frontal cloud bands wrapping all the way around the well-defined center (49N 10W), a broad comma-like feature, and cold (white on infrared imagery) cloud tops indicating that the system has great vertical extent. Table 1 has selected ship and buoy reports around the storm. The storm subsequently drifted northeast and weakened to a gale late on the 28th near Ireland before turning southeast toward Spain and continuing to weaken.
| OBSERVATION | POSITION | DATE/TIME (UTC) | WIND (kts) | SEAS (m/ft) |
| Ernest Shackleton
(ZDLS1) |
46N 9W | 27/0000 | SE 65 | |
| Heidelberg Express
(DEDI) |
47N 11W | 27/1000 | W 65 | |
| Ernest Shackleton
(ZDLS1) |
44N 9W | 27/1800 | W 40 | 8.5/28 |
| CGM Saint Exupery
(ELVB6) |
48N 7W | 27/2300 | SW 50 | |
| Galveston Bay (WPKD) | 47N 14W | 28/1200 | NW 40 | 10.7/35 |
| SHIP | 48N 17W | 28/1800 | NW 50 | 7.3/24 |
| Buoy 62163 | 48N 9W | 27/0900 | S 35 | 7.6/25 |
| Buoy 62029 | 49N 12W | 27/1300 | W 45 | |
| Buoy 62163 | 48N 9W | 27/1400 | SW 40 | 11.0/36 |
| Buoy 62565 | 54N 17W | 28/0700 | N 50 |
Table 1. Some observations taken off the coast of Western Europe around the storm of October 26-28, 2004.
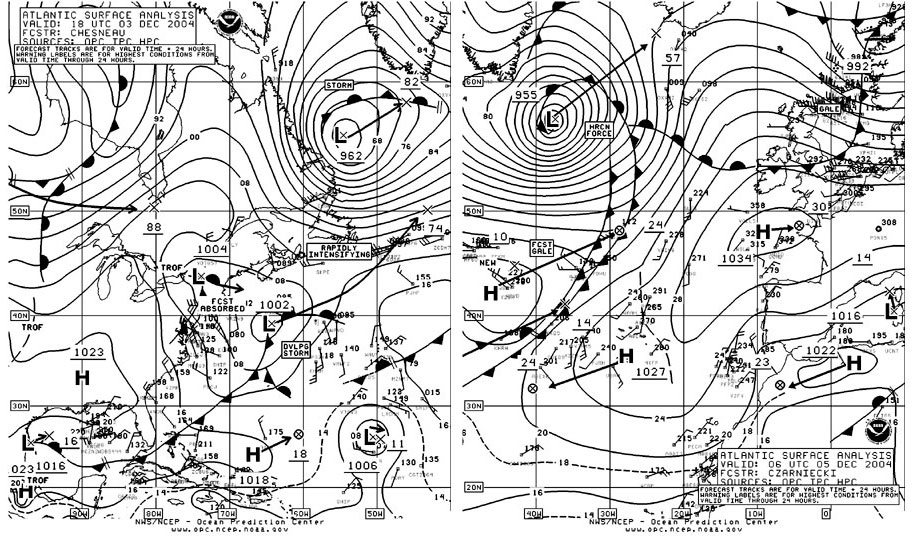
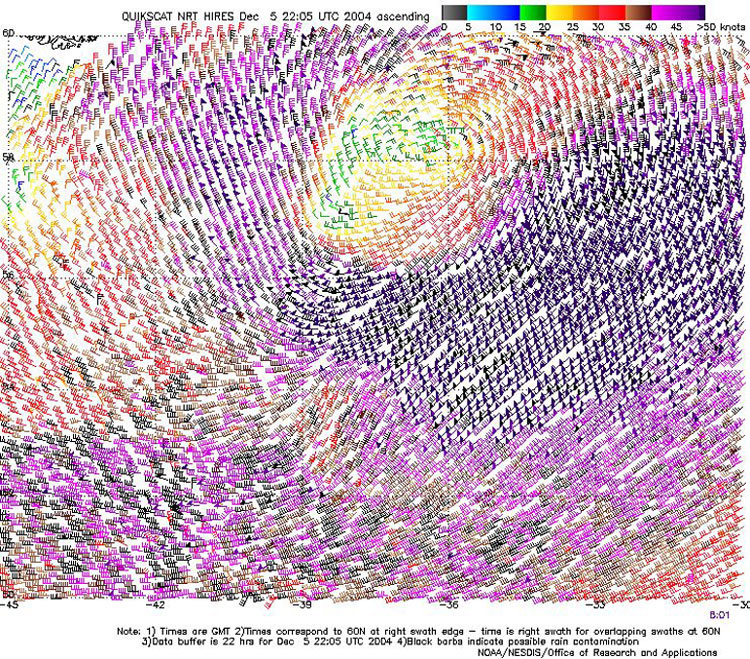
North Atlantic Storm of December 3-7: This intense system originated as a frontal wave near the southeast coast of the U.S. late on December 2 and is depicted in Figure 6. The central pressure fell 47 hPa during the 36-hour period covered by Figure 6, during which it absorbed the low and front over the northeast U.S. and the 962 hPa storm shown in the Labrador Sea in the first panel of the figure. The Grand Banks oil platforms reported northwest winds to 60 kts as the deepening storm passed nearby at 1200 UTC December 4. The storm moved into an area of sparse ship data, but the high-resolution QuikScat winds in Figure 7 reveal numerous wind barbs in the 65 to 75 kts range south and east of the center. The data show a well-defined center at 58N 36W. The Atlantic Peace (DEOT) reported a north wind of 60 kts near 62N 40W near the Greenland coast at 1200 UTC on the 5th. The central pressure bottomed out at 954 hPa at that time, after which the system began to weaken and passed northeast of Iceland early on December 7.
|
|
Northwest Atlantic Storm of December 6-8: This storm immediately followed the storm described in the preceding paragraph but tracked farther north and was not as intense. It still produced hurricane-force winds. The cyclone moved from southern Labrador late on December 5 to 60N 40W at 1200 UTC December 7 with a 972 hPa central pressure. Platform (VEP717) in the Grand Banks reported a west wind of 65 kts at 0000 UTC on the 7th. The Atlantic Peace (DEOT) experienced northeast winds of 70 kts near 62N 41W at 1200 UTC December 7. The storm then moved northeast, passing northwest of Iceland late on the 8th.
|
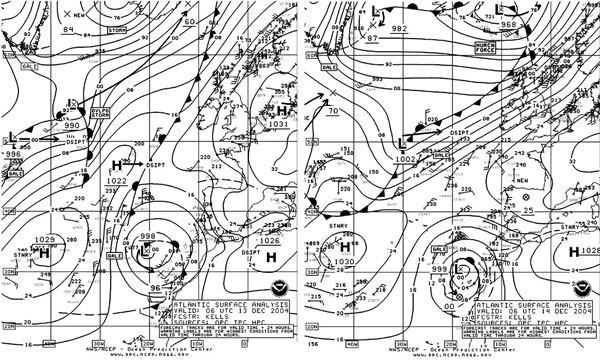
Figure 8. OPC North Atlantic Surface Analysis charts (Part 1) valid 0600 UTC December 13 and 14, 2004. |
North Atlantic Storm of December 13-14: This storm developed from a frontal wave which moved northeast from the Canadian Maritimes on December 12, and is shown in the first part of Figure 8 southeast of Greenland. The system moved rapidly northeast to become a hurricane-force storm while passing east of Iceland early on the 14th (second part of Figure 8). The Irena Arctica (OXTS2) (near 62N 11W) reported west winds of 70 kts as the storm center passed to the north at 0600 UTC December 14. To the northwest, the ship Helgafell (MYCF3) near 63N 14W encountered west winds of 55 kts at that time. The storm then passed rapidly northeast of Iceland shortly thereafter.
North Atlantic Storm of December 14-16: This storm followed a track similar to that of the December 13-14 event and similarly affected mainly the far northern waters. The system developed hurricane-force winds after passing 30W at 1200 UTC on the 15th, then reached maximum intensity (960 hPa) near 61N 26W six hours later. While the storm was passing north of the British Isles at 1200 UTC on the 16th, the ocean station Minna (MASH6) at 57N 6W reported west winds of 70 kts. The system then weakened to a gale while passing northwest of Norway on December 17.
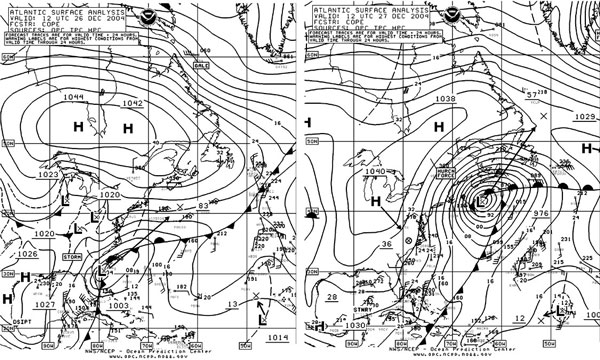
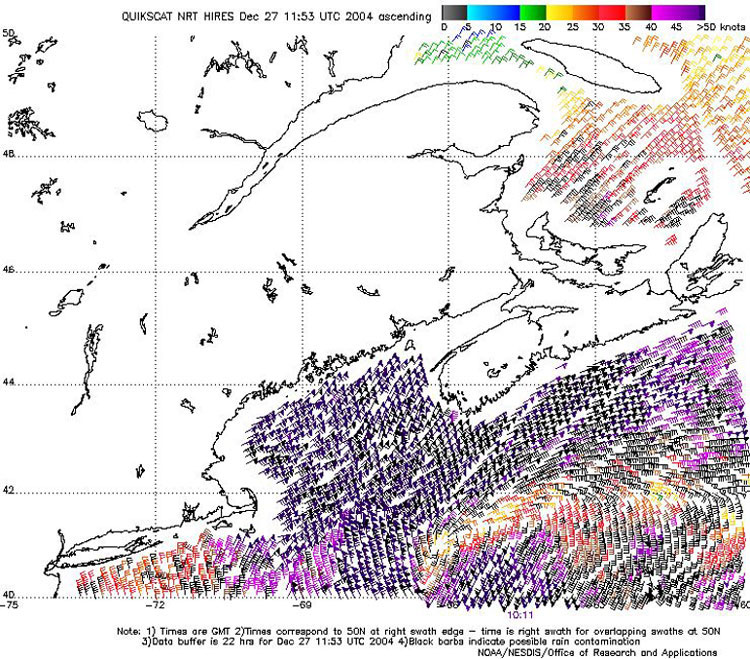
North Atlantic Storm of December 26-29: This final significant event could be considered the climax of the four-month period. Its initial development is depicted in Figure 9 . This system affected a large area of the western and northern Atlantic waters with warning conditions, and maintained hurricane-force strength far longer than any other storm in this period, more than 36 hours beginning early on the 27th. The central pressure dropped 27 hPa in the initial twenty-four hour period of rapid deepening shown in Figure 9. The high-resolution QuikScat image of Figure 10 shows a large area of winds in the 60 to 80 kts range affecting the waters east of New England and south of Nova Scotia. Some conventional surface observations taken during the storm are listed in Table 2.
|
|
| OBSERVATION | POSITION | DATE/TIME (UTC) | WIND (kts) | SEAS (m/ft) |
| APL Beijing (A8FL7) | 43N 61W | 27/1200 | E 65 | |
| Geysir (WCZ5528) | 41N 64W | 27/1200 | NW 60 | |
| Finnwood (SJEI) | 45N 58W | 28/0000 | SW 70 | |
| Buoy 44004 | 38.5N 70.5W | 27/0300
27/0400 |
NW 45 G54
Peak gust 62 |
7.0/23 |
| Buoy 44008 | 40.5N 69.4W | 27/0700
27/0800 |
N 45 G54 Peak gust 60 | 9.0/30 |
| Buoy 44011 | 41.1N 66.6W | 27/1200
27/1200 27/1400 |
NW 52 G68
Peak gust 72 |
8.5/28
10.0/33 |
| Buoy 44137 | 42.3N 62.0W | 27/1600
27/1700 |
SW 56 G 72 | 10.5/34
11.5/38 |
| Buoy 44142 | 42.5N 64.0W | 27/0800
27/0900 |
NE 49 G62 9.0/30 | 10.0/33 |
| Buoy 44139 | 44N 57W | 28/0100 | SW 45 | 12.8/42 |
| Mount Desert
C/MAN |
44N 68W | 27/110 | N 51 G57
Peak gust 61 |
Table 2. Selected ship, buoy and C/MAN reports taken during the storm of December 26-29, 2005.
The storm center crossed the island of Newfoundland on the evening of the 27th and then continued on a north-northeast track, developing a lowest central pressure of 955 hPa while passing between Greenland and Iceland at 0600 UTC December 29. The system then passed north of Iceland shortly thereafter.
Page last modified: