Eastern North Pacific Hurricane Season of 2004
Jack Beven, Lixion Avila, Richard Pasch, National Hurricane Center/Tropical Prediction Center, NOAA/NWS Miami, FLIntroduction
The number of tropical cyclones was below average in the eastern North Pacific in 2004. There were twelve named tropical cyclones; six of these became hurricanes. Three of the hurricanes reached category 3 or higher intensity on the Saffir Simpson hurricane scale, all far from land. The long term averages for this basin are sixteen named tropical cyclones and nine hurricanes. In addition, there were 4 tropical depressions. The genesis of most of the tropical cyclones was associated with westward-moving tropical waves.
The season was benign, with no reports of deaths or damage attributed to tropical cyclones. None of the cyclones made landfall as tropical storms or hurricanes. However, Javier reached Baja California as a tropical depression, and Tropical Storm Lester brushed the southwest coast of Mexico. Tropical Depression Sixteen-E made landfall on the west coast of Mexico, producing heavy rains.
There were only two ship observations of tropical-storm force winds during the season, one from Hurricane Howard and the other from Hurricane Javier.
Individual Storms
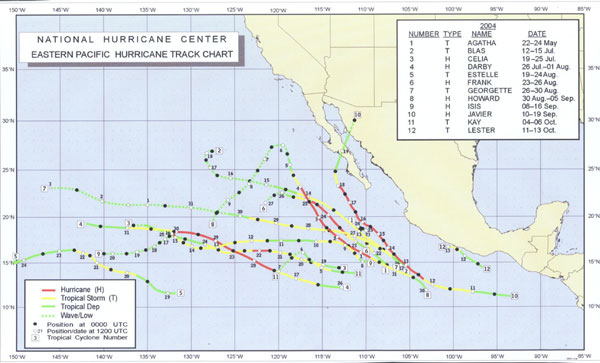
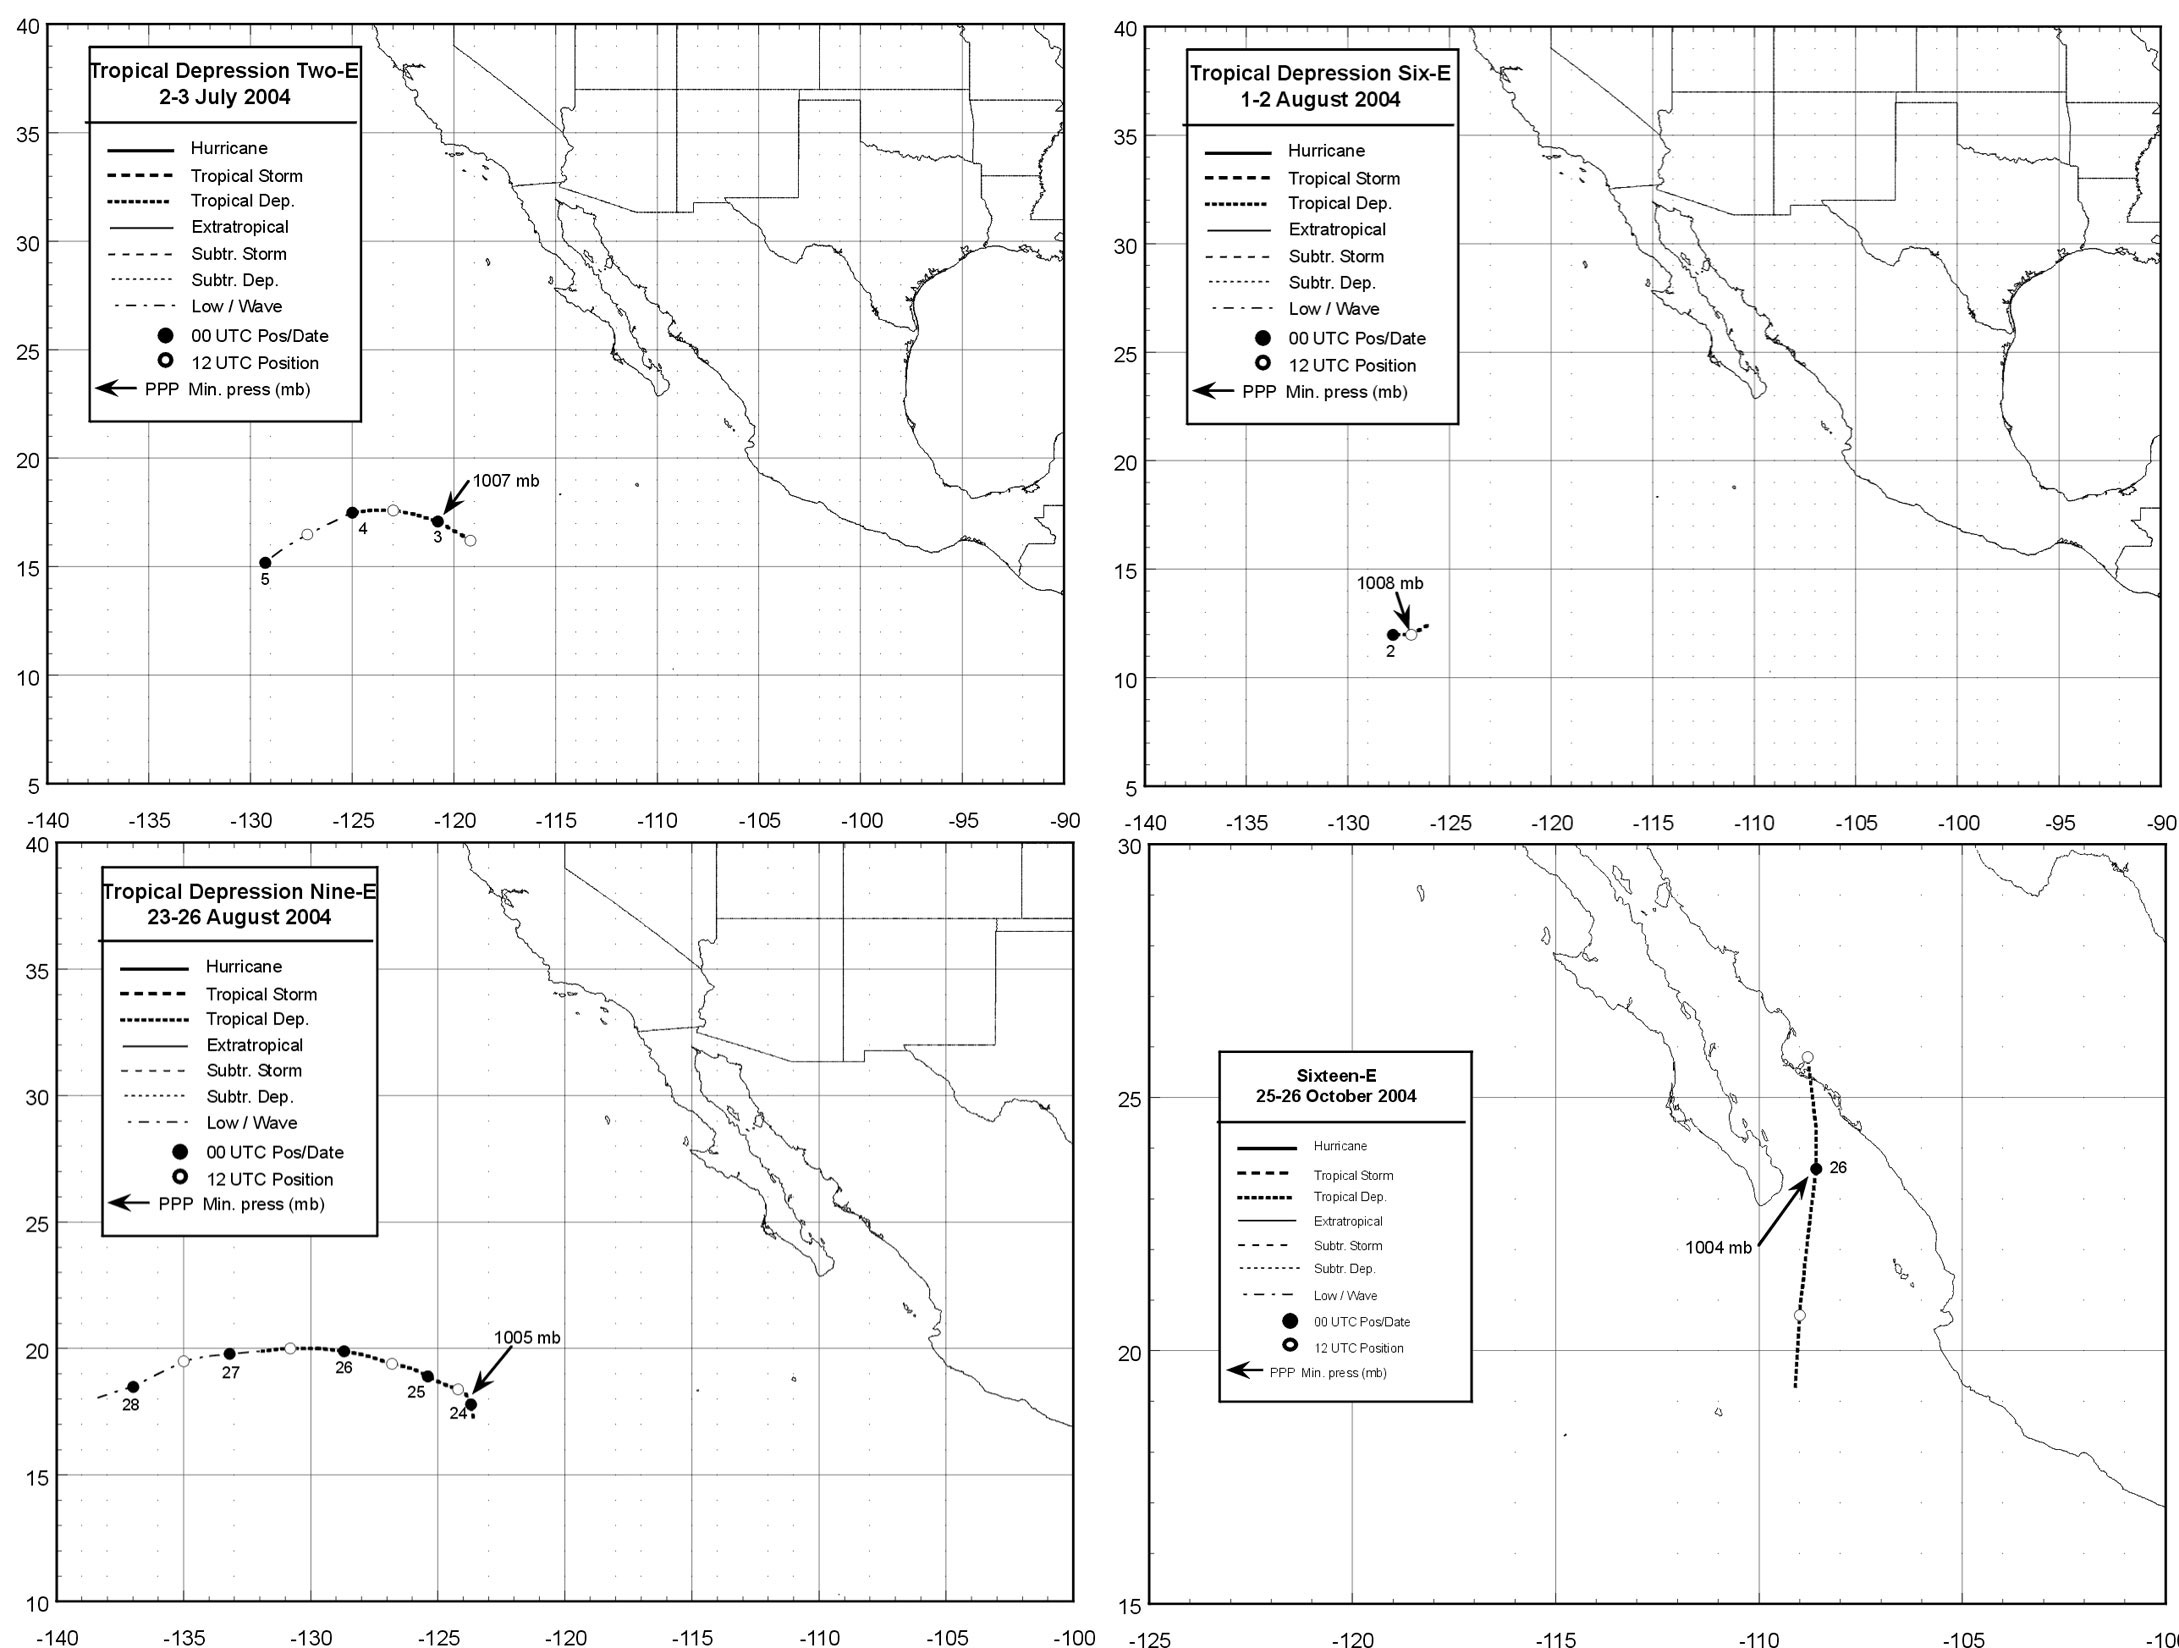
The vital statistics of the named storms of 2004 are given in Table 1, while the tracks are shown in Figure 1. The tracks of the tropical depressions are shown in Figure 2. In the cyclone summaries given below, al dates are based on Universal Coordinated Time, although local time is implied with expressions such as "afternoon," "mid-day," etc.
|
|
Tropical Storm Agatha
Agatha, the first tropical cyclone of the season, formed from an area of disturbed weather associated with a tropical wave and a nearly stationary area of low pressure. It first became a tropical depression on 22 May about 500 nmi south-southeast of Cabo San Lucas, Mexico. The cyclone moved slowly toward the northwest and strengthened under light vertical wind shear. It is estimated that it became a tropical storm later that day and reached its estimated peak intensity of 55 kts on 23 May. Soon thereafter, cooler sea surface temperatures and stable air caused the cyclone to weaken, and Agatha degenerated into a nearly stationary remnant low by 24 May. This low dissipated about 305 nmi south of Cabo San Lucas on 25 May.
| Name | Classa | Datesb | Maximum
wind (kts.) |
Minimum pressure
(hPa) |
Deaths |
| Agatha | TS | 22-24 May | 50 | 997 | |
| Blas | TS | 12-15 Jul | 55 | 991 | |
| Celia | H | 19-25 Jul | 75 | 981 | |
| Darby | H | 26 Jul-1 Aug | 105 | 957 | |
| Estelle | TS | 19-24 Aug | 60 | 989 | |
| Frank | H | 23-26 Aug | 75 | 979 | |
| Georgette | TS | 26-30 Aug | 55 | 995 | |
| Howard | H | 30 Aug-5 Sep | 120 | 943 | |
| Isis | H | 8-16 Sep | 65 | 987 | |
| Javier | H | 10-19 Sep | 130 | 930 | |
| Kay | TS | 4-6 Oct | 40 | 1005 | |
| Lester | TS | 11-13 October | 45 | 1000 |
Table 1. 2004 Eastern North Pacific tropical storms and hurricanes.
a Tropical storm (TS): wind speed 34-63 kts. Hurricane (H): wind speed 64 kts or higher.
b Dates begin at 0000 UTC and include tropical depression stages.
Tropical Storm Blas
Blas formed from a tropical wave that emerged from western Africa on 1 July and crossed Central America on 8 July. Over the next several days, deep convection increased and slowly became organized to the south of Mexico. The system became a tropical depression on 12 July about 280 nmi south of Manzanillo, Mexico, and strengthened into a tropical storm later that day. The storm moved northwestward at a relatively fast forward speed around the southwest side of a mid-level anticyclone centered over the southwestern United States, and reached its estimated peak intensity of 50 kts on 13 July. Blas moved over cooler waters and weakened to a tropical depression by the 14th. It soon degenerated into a remnant low that dissipated well to the west of central Baja California.
Blas had a large circulation that affected Baja California even though the center remained well offshore. An automated station just north of Cabo San Lucas at an elevation of 225 m above sea level reported a maximum sustained wind of 41 kts at 1630 UTC 13 July and a peak gust of 57 kts at 1750 UTC that day. Shipping avoided the strongest winds associated with Blas, as no ships reported tropical-storm force winds.
Hurricane Celia
Celia, the first hurricane of the season, formed from a fairly vigorous tropical wave that moved across the west coast of Africa on 5 July. The wave moved westward across the tropical Atlantic and northern South America for the next week and emerged over the northeastern Pacific Ocean near Panama on 13 July. There, a low-level circulation became better defined and convection gradually increased. It was not until early on 19 July, however, that the convective organization and circulation increased sufficiently for the system to be designated a tropical depression. By then, the cyclone was located about 540 nmi south-southwest of Cabo San Lucas. Steady development continued while the cyclone moved west-northwestward around the southern periphery of a subtropical high pressure ridge. It is estimated that the depression became a tropical storm later on 19 July and reached an estimated maximum intensity of 75 kts on 20 July. Thereafter, Celia began a slow weakening trend as it moved over cooler water, becoming a depression on 24 July and eventually degenerating into a remnant low on 26 July. The system dissipated later that day about 1510 nmi west-southwest of Cabo San Lucas.
Hurricane Darby
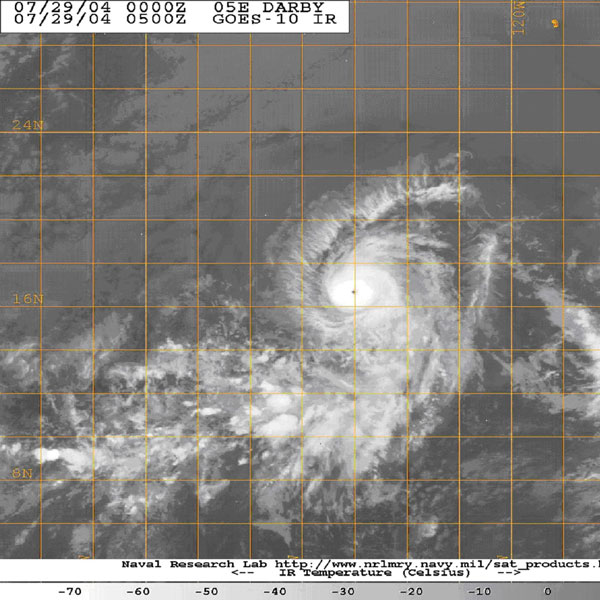 |
Figure 3. GOES-10 infrared image of Hurricane Darby at 0500 UTC 29 July 2004. Image courtesy of the Naval Research Laboratory, Monterey, CA |
Darby's formation is associated with a tropical wave that reached the eastern Pacific on 20 July and first showed signs of organization on 24 July. A tropical depression subsequently formed on 26 July about 660 nmi south-southwest of Cabo San Lucas. The tropical cyclone moved west-northwestward and strengthened to a tropical storm the next day. Darby became a hurricane on 28 July and reached its estimated maximum intensity of 105 kts the next day (Figure 3). Darby turned westward on 30 July as it weakened to a tropical storm. The cyclone became a depression on 31 July shortly before entering the central Pacific tropical cyclone basin.It continued westward and dissipated on 1 August about 740 nmi east of the Hawaiian Islands. The remnants of Darby continued westward in the low-level trade winds and caused heavy rains and flooding over portions of the Hawaiian Islands on 3-4 August.
Tropical Storm Estelle
Estelle formed from an area of disturbed weather in the Intertropical Convergence Zone that was enhanced by the arrival of a tropical wave. It became a tropical depression on 19 August about 1250 nmi east-southeast of Hilo, Hawaii. Based on surface wind data from the National Aeronautics and Space Administration (NASA) QuikSCAT satellite, it is estimated that the cyclone reached tropical storm status on 20 August. Estelle moved toward the west-northwest and its maximum winds reached an estimated 60 kts on 21 August.
Thereafter, the cyclone began to move toward the west and west-southwest, and weakened due to strong wind shear. Estelle became a remnant low on 24 August and dissipated on 26 August about 305 nmi south of the Hawaiian Islands.
Hurricane Frank
Frank formed from the same wave that spawned Tropical Storm Earl in the Atlantic Ocean. The wave continued westward after Earl dissipated and crossed Central America on 18 August. Over the next five days, deep convection gradually increased and by early on 23 August, the convection was organized enough to classify the system as a tropical depression about 360 nmi south of Cabo San Lucas. Rapid development then occurred, and it is estimated that the cyclone strengthened into a tropical storm and then a hurricane later that day, the latter when an eye feature became apparent in visible and microwave imagery. Frank moved west-northwestward to northwestward and reached its estimated peak intensity of 75 kts on 24 August. Thereafter, Frank gradually weakened due to cooler sea-surface temperatures and turned back toward the west-northwest. The circulation remained well-defined but the cyclone finally degenerated into a remnant low on 26 August and dissipated later that day about 650 nmi miles west-southwest of Cabo San Lucas.
Tropical Storm Georgette
Georgette formed from a tropical wave that reached the Gulf of Tehuantepec on 24 August. Surface winds measured during a QuikSCAT overpass indicated a weak surface low pressure area formed along the wave axis early the next day. The cloud pattern became sufficiently well-organized to designate the system a tropical depression on 26 August, about 525 nmi south-southeast of Cabo San Lucas. Deep convection continued to become better organized and it is estimated that the tropical cyclone strengthened into a tropical storm later that day. The storm reached its estimated peak intensity of 50 kts on 27 August. Shortly thereafter, upper-level northeasterly wind shear became established over the cyclone. Georgette slowly weakened while it moved west-northwestward over cooler water, and degenerated into a remnant low on 30 August. The low remained devoid of significant convection while it moved west-northwestward over progressively colder water for the next 4 days. It dissipated early on 3 September about 520 nmi northeast of the Hawaiian Islands.
Hurricane Howard
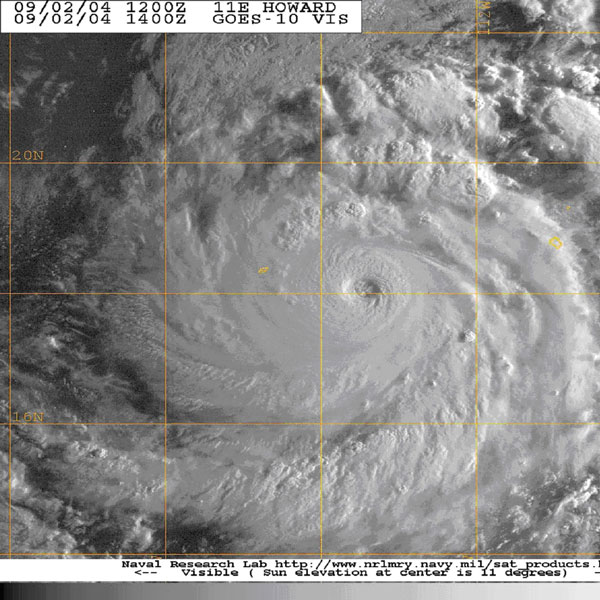 |
Figure 4. GOES-10 visible image of Hurricane Howard at 1400 UTC 2 September 2004. Image courtesy of the Naval Research Laboratory, Monterey, CA |
The tropical wave that spawned Howard reached the eastern North Pacific on 26 August. Development began on 29 August and a tropical depression formed the next day about 350 nmi south-southwest of Acapulco, Mexico. It moved toward the west-northwest away from the coast, becoming a tropical storm on 31 August and a hurricane on 1 September. Howard turned northwestward and reached an estimated peak intensity of 120 kts on 2 September (Figure 4). This was followed by a gradual weakening as Howard moved northwestward over cooler sea surface temperatures. Howard weakened to a tropical storm on 4 September and the cyclone became a remnant low the next day about 230 nmi west-southwest of Punta Eugenia, Mexico. The remnant low first moved slowly northwestward and then southwestward, finally dissipating about 1,000 nmi west-southwest of Cabo San Lucas on 10 September.
The only observation of tropical-storm force winds in Howard was from the ship Strong Virginian (KSPH), which reported winds of 37 kts at 0600 UTC 4 September.
Hurricane Isis
The disturbance that developed into Isis was a tropical wave that entered the eastern North Pacific basin on 3 September and continued westward for several days. By 8 September, when the disturbance was located about 460 nmi south of Cabo San Lucas, Mexico, it had sufficient circulation and convective organization to be considered a tropical depression. The depression strengthened into a tropical storm later that day and moved generally westward for the next several days. Under easterly shear, the cyclone weakened back to a depression on 10 September when its deep convection temporarily evaporated. Isis re-strengthened to a tropical storm on 12 September about 725 nmi west-southwest of Cabo San Lucas, and its maximum winds reached 45 kts later that day. There was little change in strength until 14 September. The easterly shear had been decreasing, and late on 14 September Isis again re-strengthened-this time rapidly. Isis developed a "ragged eye", and it is estimated that the cyclone reached a peak intensity of 65 kts on 15 September while centered about 1260 nmi west of Cabo San Lucas. As quickly as the eye developed, it disappeared. Isis moved over cool waters and steering currents collapsed, resulting in little motion and significant weakening. The system degenerated into a remnant low on 16 September about 1,300 nmi west of Cabo San Lucas. The remnant low drifted southwestward and then westward for a few days, generating intermittent convection before dissipating on 21 September about 875 nmi east of the Hawaiian Islands.
Hurricane Javier
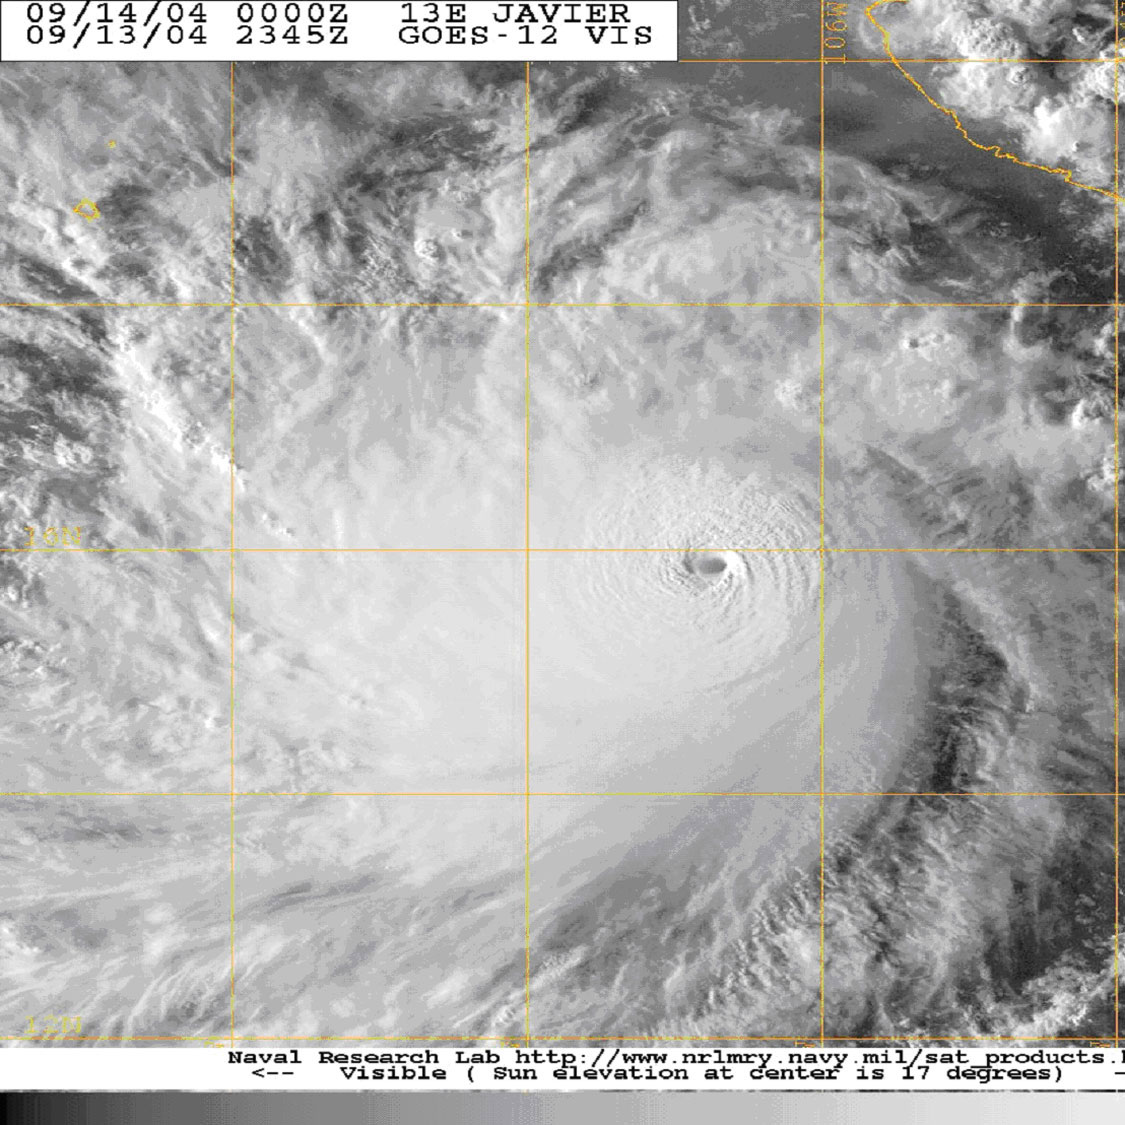 |
Figure 5. GOES-12 visible image of Hurricane Javier at 2345 UTC 13 September 2004. Image courtesy of the Naval Research Laboratory, Monterey, CA |
Javier, the strongest hurricane of the season, formed from a tropical wave that entered the eastern Pacific on 9 September and moved westward with deep convection but limited upper-level outflow. As the upper-level winds became more favorable, the system developed into a tropical depression on 10 September about 300 nmi south-southeast of Salina Cruz, Mexico and became a tropical storm the next day. Under light wind shear, Javier continued to strengthen and reached hurricane status on 12 September. The hurricane then moved slowly between the west-northwest and northwest around the periphery of a subtropical ridge centered over Mexico. On 13 September, Javier rapidly intensified as indicated by the quick development of a distinct eye. The hurricane reached its estimated peak intensity of 130 kts (category 4) on 14 September while centered about 270 nmi south-southwest of Manzanillo (Figure 5). Thereafter, Javier weakened, but maintained category 3 intensity for the next three days. Javier moved northwestward over cool waters and this, along with strong southwesterly wind shear, resulted in weakening. The cyclone then turned northward to north-northeastward and, as a weakening tropical depression, crossed Baja California between Cabo San Lazaro and Punta Abreojos in the morning of 19 September. The depression continued toward the north-northeast over the Sea of Cortez and degenerated into a remnant low later that day. The low moved inland near Guaymas, Mexico, and dissipated over the high terrain of the state of Sonora on 20 September. Mid-level moisture from Javier spread northeastward over northern Mexico and the southwestern United States.
The only observation of tropical-storm force winds from Javier was from the ship Tamesis (LAOL5), which reported winds of 35 kts at 0900 UTC 15 September.
Tropical Storm Kay
Kay developed from an area of disturbed weather associated with a tropical wave and a disturbance in the Intertropical Convergence Zone. A tropical depression formed from them on 4 October about 515 nmi southwest of Manzanillo. Geostationary satellite imagery, along with data from the NASA QuikSCAT and Tropical Rainfall Measuring Mission (TRMM) satellites, indicated the depression strengthened to a tropical storm early on 5 October approximately 640 nmi west-southwest of Manzanillo. Kay moved west-northwestward around the southwest side of a strong mid-level anticyclone centered over the southwestern United States. It reached its estimated peak intensity of 40 kts later on 5 October. Thereafter, deep convection decreased and the center of the cyclone became separated from the main area of thunderstorms. Kay gradually weakened and degenerated into a remnant low on 6 October and dissipated later that day about 750 nmi west-southwest of Cabo San Lucas.
Tropical Storm Lester
Lester formed from a persistent area of disturbed weather first seen southwest of the Gulf of Tehuantepec. A tropical depression developed from the disturbance on 11 October about 80 nmi south of Puerto Escondido, Mexico. The center of the depression moved slowly west-northwestward very near the Mexican coast. It became a tropical storm late on 12 October while located about 50 nmi southeast of Acapulco. Lester reached its estimated 45 kts peak intensity 6 to 12 hours later. Based on radar images from Mexico, the center of the compact storm passed just south of Acapulco early on 13 October. The interaction with both land and a larger low pressure area to the southwest weakened the cyclone, and data from an Air Force Reserve Unit Hurricane Hunter Aircraft indicated that Lester had degenerated into a trough of low pressure late on 13 October. Lester brought locally heavy rainfall to portions of the Mexican states of Oaxaca and Guerrero, but no reports of significant flooding, or of casualties or damages were received.
Tropical Depression Sixteen-E
Tropical Depression Sixteen-E, the last cyclone of the season, was a short-lived cyclone that developed from a long-lived area of disturbed weather. The disturbance was first noted south of Guatemala on 19 October and it drifted slowly westward with little development until it was south of Cabo San Lucas on 23 October. Slow development then occurred, and a tropical depression formed about 275 nmi south-southeast of Cabo San Lucas, Mexico early on 25 October. As the cyclone began to accelerate northward later that afternoon, strong southwesterly vertical shear displaced most of the convection to the east. The depression continued its northward motion and crossed the extreme southeastern portion of the Sea of Cortez, before moving inland along the northwestern coast of Mexico midway between Guasave and Topolobampo on 26 October. The depression dissipated over land later that day.
A wind gust to 70 kts was reported at Culiacan, Mexico at 0227 UTC 26 October. Heavy rains f/ell along the coastal and mountain regions of west-central and northwestern Mexico causing some localized flooding and the mid-level moisture associated with the depression eventually spread northeastward over northern Mexico and into portions of the U.S. southern plains.
Other Tropical Depressions
Tropical Depression Two-E occurred from 2-3 July southwest of Cabo San Lucas. Tropical Depression Six-E occurred from 1-2 August over open waters well to the southwest of Cabo San Lucas. Tropical Depression Nine-E formed about 800 nmi west-southwest of Cabo San Lucas on 23 August and moved generally west-northwestward until it weakened into a remnant low on 26 August.
Acknowledgments:
The cyclone summaries are based on reports prepared by the authors and the other Hurricane Specialists at the National Hurricane Center: James Franklin, Miles Lawrence, and Stacy Stewart. Additional material was contributed by Rick Knabb and David Roberts. Stephen Baig prepared the track map.
Page last modified: