Marine Weather Forecasting in the National Weather Service (NWS)
The National Weather Service Marine Program has a mission to provide marine weather forecasts, warnings, and other information for the protection of life and property while on the waters. Weather and ocean data are critical to the mariner. This is due to a combination of hazards – such as strong wind and large waves – and the inherent isolation while on the water. Mariners in smaller vessels encountering hazardous conditions in the coastal waters and Great Lakes may be hours away from safe port and at the mercy of the elements. Large ships at sea also face potentially great dangers and are often days away from a safe port. When in peril, rescue of these vessels may be hours or days in coming. Reliable, rapid, and easy access to weather information, when properly understood and applied, supports decisions which ultimately lead to saving lives and reducing economic losses. Not having accurate and timely weather information and the knowledge to properly apply it, increases risk to mariners and their vessels.
NOAA’s National Weather Service is responsible for issuing marine forecasts and warnings for the U.S. coastal waters and Great Lakes, offshore and high seas portions of the Pacific and Atlantic Oceans, Gulf of Mexico, Caribbean, and for a portion of the Arctic Ocean (north of Alaska).
In coastal areas, NWS provides vital services and products to inform and protect residents, businesses, tourists, and others from hazardous weather and surf conditions. Typically in the coastal community, rip currents, inundation due to storms and unusually high tides are the primary focus. Marine observations and forecasts also support ecological assessments and predictions, disaster response, and decision support services.
The NWS marine forecast services support vital decision-making processes for short, medium, and long-range planning, emergency response, and hazard mitigation. This empowers mariners and other users to be better informed – and therefore safer and more productive.
Over half of the U.S. population lives within 50 miles of the coast. At sea, maritime commerce has tripled in the last 50 years. In the following sections, we will explain how marine weather forecasts are made, the history of marine weather forecasting, and then take a look at the future of marine weather forecasting.
The History of Marine Weather Forecasting in the National Weather Service
In 1870, a Joint Congressional Resolution requiring the Secretary of War "to provide for taking meteorological observations at the military stations in the interior of the continent, and at other points in the States and Territories...and for giving notice on the northern lakes and on the seacoast, by magnetic telegraph and marine signals, of the approach and force of storms" was introduced. Congress passed the resolution and on February 9, 1870, President Ulysses S. Grant signed it into law. A new national weather service was born within the U.S. Army Signal Service’s Division of Telegrams and Reports for the Benefit of Commerce that would affect the daily lives of most of the citizens of the United States through its forecasts and warnings for years to come.
A Marine weather program began on January 23, 1873 at the United States Army Signal Service’s Division (US Army Signal Corps today) in New Orleans, Louisiana. On that day, the Signal Observer transcribed meteorological data from the ship logs of those arriving in port. On October 1, 1890, the weather service becomes a civilian agency when Congress, at the request of President Benjamin Harrison, passes an act transferring the meteorological responsibilities of the Signal Service to the newly-created U.S. Weather Bureau in the Department of Agriculture. Official three-day marine weather forecasts for the North Atlantic began in 1901 (from U.S. Navy). The responsibility of marine forecasting was transferred to the Weather Bureau in 1904 and in 1905, the SS New York transmits the first wireless weather report received on ship at sea.
In the early 1900s, the Norwegian Cyclone Model created by V. and J. Bjerknes provided the first glimpse as to the structure of the atmosphere across the mid latitudes. This meteorological advancement and the increase in shipboard observations for the first time provided the ability for meteorologists to create a crude map of the state of the atmosphere.
In 1912, the RMS Titanic sank and in response, the International Convention for the Safety of Life at Sea (SOLAS) was formed in 1914. A maritime safety treaty, SOLAS determines requirements for safer ocean voyages across the globe ensuring that ships flagged by signatory States comply with minimum safety standards in construction, equipment and operation.
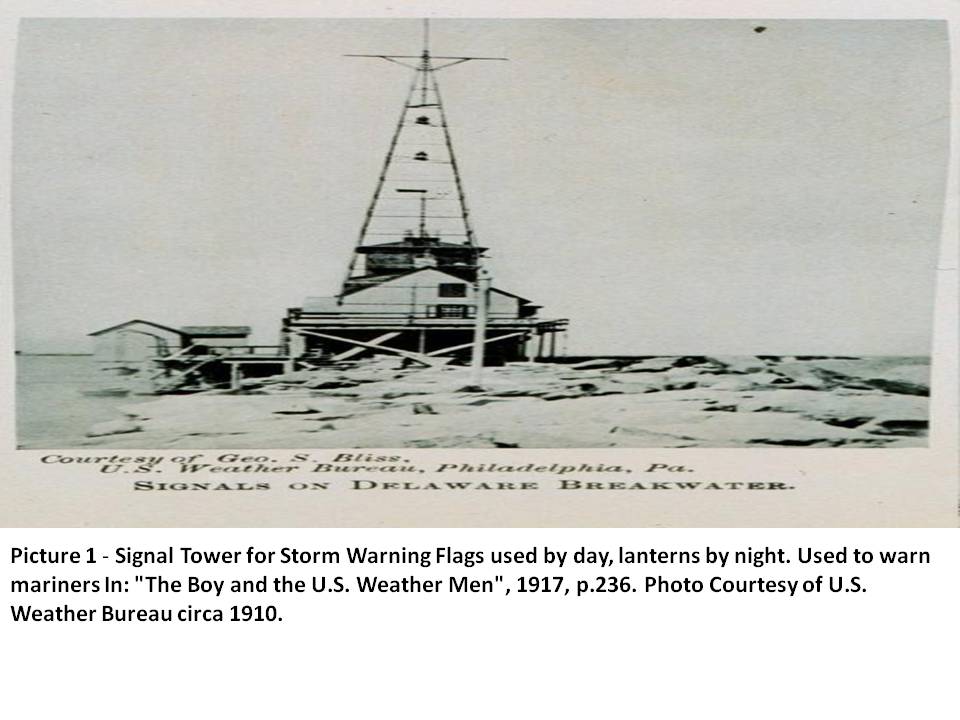
A hurricane warning service was established in 1935. In 1940, the Navy established a weather center and President Roosevelt ordered the U.S. Coast Guard to man ocean weather stations. A defining moment in marine weather forecasting occurred during WW II when the decision to invade Normandy on June 6, 1944 was based on accurate weather forecasts indicating the correct combination of tides and winds.
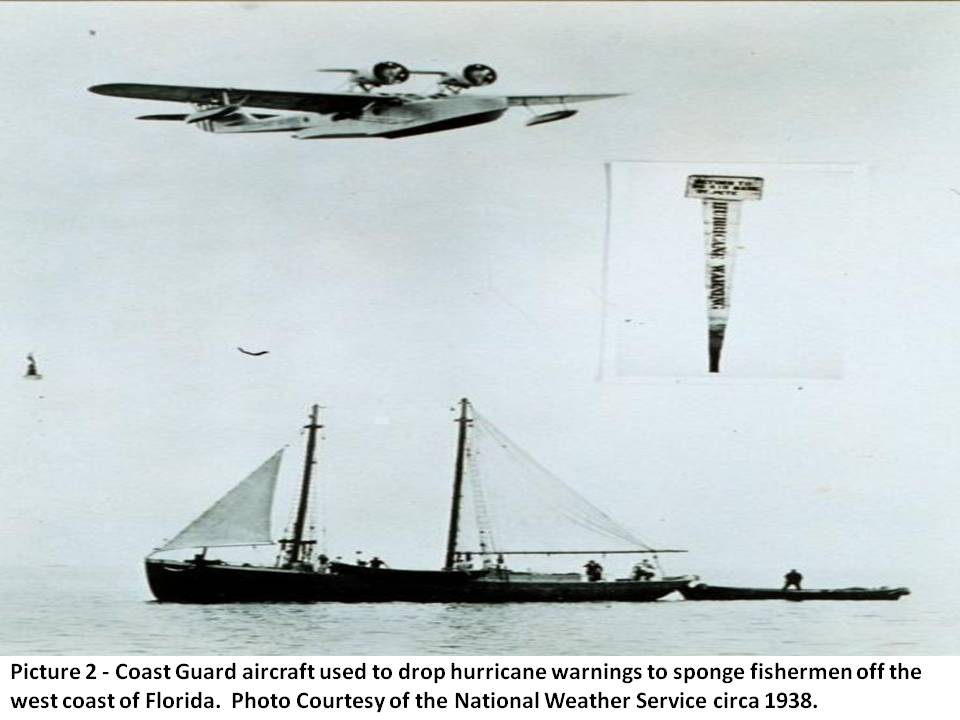
In 1957, the United States Weather Bureau started to publish the Mariners Weather Log, a bi-monthly publication addressing marine issues. The Mariners Weather Log is still published today and documents significant storms over and near the Earth's oceans and the Great Lakes of North America, tropical cyclones and non-tropical cyclones.
The U.S. Weather Bureau became the National Weather Service in 1970. Forecast weather maps began to be published by offices in New York City, San Francisco, and Honolulu for public use. North Atlantic forecasts were shifted from a closed U.S. Navy endeavor to a National Weather Service product suite via radiofacsimile in 1971, while northeast Pacific forecasts became publicly available by the same method in 1972.
In 1975, the first "hurricane hunter" Geostationary Operational Environmental Satellite (GOES) is launched into orbit; these satellites with their early and close tracking of hurricanes, greatly reduce the loss of life from tropical cyclones. In 1977, the success of weather satellites results in the elimination of the last U.S. weather observation ship; real time access to satellite data by national centers advances hurricane, marine and coastal storm forecasts.
It was not until the turn of the 20th century that radio communications became commonplace on ocean faring vessels, which allowed for ships to contact and be contacted by other ships or land. While early radio communications were not standardized and mainly tailored to the ability of passengers to receive telegrams, it was the first time in which real-time observations were able to be relayed to others in the region. During this same time the density of meteorological observations and understanding of the atmosphere was increasing at a rapid rate.
Today, the Ocean Prediction Center and the Tropical Analysis and Forecast Branch are responsible for issuing Offshore and High Seas forecasts and warnings for much of the North Atlantic and North Pacific Oceans including tropical sections such as the Caribbean Sea and Gulf of Mexico. These forecasts are broadcast internationally via SafetyNET, the international service for the broadcast and automatic reception of maritime safety information (MSI) and search and rescue (SAR) related information and NAVTEX (Navigational Telex), an international automated medium frequency direct-printing service used for delivery of navigational and meteorological warnings and forecasts within 200 nm of the coasts. Individual Weather Forecast Offices are responsible for issuing marine forecasts and warnings for near shore coastal waters of the U.S. and its territories.
Marine Weather Forecasting Today
Marine forecasting, that of telling the future state of wind and wave conditions, is millennia’s old. However, techniques of marine forecasting have come a long way in the last several thousand years, bringing us into the modern era of marine observations via satellite and buoys, and forecasting using sophisticated computer programs. The role of marine weather forecasters worldwide is a complicated one and will continue to change in response to evolving technology and user requirements.
Over the course of time and through the understanding of changing weather patterns, it became clear to mariners that weather controlled the conditions of the ocean. Early on however, weather forecasting over the ocean was difficult at best. In situ observations, literally meaning “on site,” were the only way of gaining information as to what the conditions were like on the water. If a mariner was skilled enough to make it back to port in poor conditions, then and only then could the severity be relayed to others preparing to venture out.
In the modern era (since the 1980s) meteorological understanding has increased at a rapid rate. In the marine environment meteorologists began accessing observations from local and transoceanic vessels as well as buoys and coastal meteorological equipment. Meteorologists also gained data from remote sensing instrumentation (i.e. satellites).
In just a 100 years, meteorologists have gone from rudimentary to highly sophisticated marine weather forecasting. Meteorologists now have access to traditional data such as buoys and ship observations, to detailed satellite imagery and an array of remote sensing equipment. Current science allows the forecaster to see the wind field across swaths of the ocean as derived by satellite. Some satellite instrumentation even allows the meteorologist to view sea heights. High frequency radar along the coast allows mariners to view detailed information regarding the surface currents.
Vast amounts of meteorological information are available to the marine forecaster today. An incomprehensible amount of data coupled with an ever growing understanding of the atmosphere has necessitated the development of advanced atmospheric numerical models. These models are driven by atmospheric physics with observations as the initial input. Atmospheric models are only limited by the computing power available. Many models now exist and are typically researched by universities and implemented operationally by governments.
Atmospheric models are not the sole beneficiary of scientific understanding and computational advancements. Wave models have also skyrocketed in their development since the 1990s when Dr. Hendrik Tolman brought wave physics to the operational realm through the development of the “wavewatch” model. The wavewatch model is primarily an open ocean wave model used globally by universities, private weather enterprise, and public weather services. Wavewatch has been possible due to the development of atmospheric models since it uses the wind field from the Global Forecast System (GFS) to drive wave development. Prior to the wave models pioneered by Dr. Tolman, only a few models from the military were developed. Otherwise wave forecasting was solely done by extrapolation by model derived wind speed using the Beaufort scale, which was instituted in 1805.
The Delft University in the Netherlands, from which Dr. Tolman came, continues to produce increasingly complex wave models through their engineering department. In the late 1990’s came the SWAN (Simulating Waves Near-shore) model from Delft. This incorporated shallow water wave physics and was only possible through increased computational power. In the early 2000’s SWAN was brought to the United States and adapted to near-shore wave modeling on the west coast. The chief benefit of using SWAN for near-shore waves has been separating it from using atmospheric models as the wind input, but instead utilizing forecaster knowledge to create a wind field which then drives local wave development. As of the first half of the 2010’s the National Weather Service has dedicated resources to taking the SWAN engine into the operational environment through the development of the Near-shore Wave Prediction System (NWPS). As computational power increases, the marine forecaster will benefit from further development of higher resolution wave models. In general, a marine forecaster must: 1. Analyze and monitor continually the marine weather situation. 2. Forecast marine weather phenomena, variables and parameters. 3. Warn of hazardous phenomena. 4. Ensure the quality of meteorological information and services. 5. Communicate meteorological information to internal and external users.
The marine forecaster’s responsibility is to continuously monitor the current situation, ongoing advisories, forecasts and warnings of weather and marine parameters and variables; and significant weather phenomena. They must determine the need for issuance, cancellation or amendment/update of advisories, forecasts and warnings according to documented thresholds and regulations. This is accomplished through maintaining a weather watch over the marine weather situation and evolving significant weather phenomena and then comparing current forecasts and warnings against observed conditions.
The forecaster must be able to interpret: - radar and satellite imagery to identify fog, severe convective system, tropical cyclone, thunderstorms, squalls, sea ice and other potentially dangerous phenomena - numerical weather prediction guidance (including Ensemble Prediction Systems), marine products and other forms of objective guidance, and their assimilation into forecast/warning preparation - observed variables and parameters when there are differences between automatic sensor technologies and manual observing techniques and the impact on forecast and warning products - coded real time raw data including buoy and ship reports
Particular knowledge required includes: Knowledge of relevant observing systems, platforms, and sensors that may include remote sensing (satellite altimeters, scatterometers, microwave sensors; radar, lightning detection systems); in-situ sensors (anemometers, tide gauges, moored wave buoys, drifting buoys, bottom pressure sensors); human observing procedures (ship, shore) and how their advantages and limitations vary with respect to prevailing seasonal and meteorological conditions.
Forecasts include many of the following parameters: -wind including directional variability, speed and wind gusts -sea state -damaging large waves or multiple swell systems -precipitation and associated horizontal visibilities -fog or mist, and associated horizontal visibilities -other types of obscuration to visibility, including smoke, haze, sand-storms, dust-storms, blowing snow, volcanic ash/rock and associated horizontal visibilities -sea ice state -synoptic situation for tropical, sub-tropical, temperate and polar climate zones as required -thunderstorms, heavy precipitation with poor horizontal visibility, down-burst/microburst, squalls or gust front, hail, tornadic/water spout activity -freezing spray or precipitation, snowfall -Icing on the vessels or structures -tropical cyclones/hurricanes/typhoons -Icebergs and their movement
Warning of hazardous phenomena is the most critical aspect to the marine forecast. Protection of life and property is of the utmost importance. Warnings must be issued in a timely manner when hazardous conditions are expected to reach documented threshold values or impacts and as appropriate, amended or cancelled, according to documented criteria. The phenomena to be warned and forecasted for includes/but may not be limited to: a. Tropical Cyclone / hurricanes / typhoons b. Wind Hazards - gales/storm/hurricane force wind c. Thunderstorms, heavy precipitation with poor horizontal visibility, down-burst/microburst, squalls or gust front, tornadic hail, tornadic/water spout activity d. Ice accretion -freezing spray or precipitation and icing on the vessels or structures e. Restricted Visibility (less than 1nm) -reduced horizontal visibility caused by precipitation, fog, smoke, smog, dust, smoke, haze, sand-storms, dust-storms and blowing snow -reduced horizontal visibility caused by volcanic activity f. Unusual and hazardous sea-ice conditions -exceptional and rapidly changing sea ice conditions -icebergs g. Storm-induced water (sea) levels -sea level and storm surge
Once the forecast and/or warning messages are complete, it must be communicated in a timely manner to meet user community needs. This is done through ensuring that all forecasts and warnings are disseminated via the authorized communication channels to user groups. NWS marine forecasters also provide marine weather briefings as necessary, providing consultation to meet specific user needs (Decision Support Services) and utilizing the forecasts and warnings of meteorological parameters and phenomena to describe their impact on marine operations.
Today, in a National Weather Service (NWS) Weather Forecast Office, marine forecasting is a complex task of viewing data, both observed and model, then synthesizing it through knowledge and experience to create a forecast product. Within the NWS, the marine forecaster uses powerful workstation computers to create a forecast.
Today, when a forecaster arrives on station for a forecasting shift the first item of business is to receive a briefing from the forecaster leaving duty. This provides immediate situational awareness to the incoming shift. Once settled at a workstation, the forecaster will check the ongoing forecast against currently available observations, both winds and seas. At times some observations will be missing which will then require the forecaster to use local knowledge and meteorological understanding to fill in the gaps in observed data. These steps are completed to ensure the ongoing forecast remains valid and does not become unrepresentative of the ongoing conditions. If the forecast is valid then no amendments are required. Otherwise, the forecast will need to be updated to reflect current conditions.
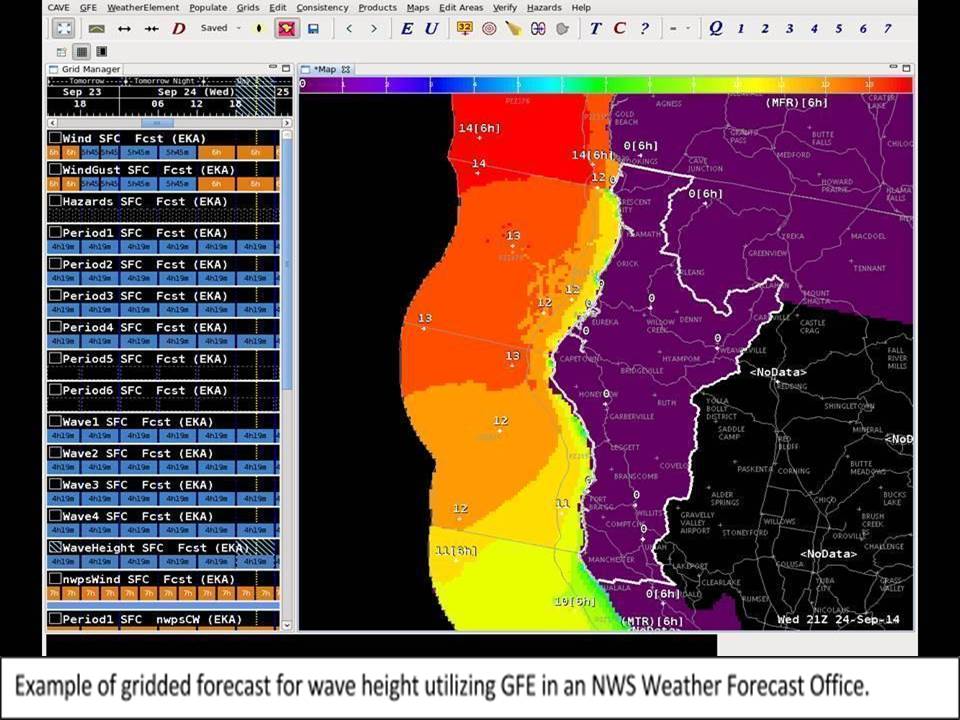
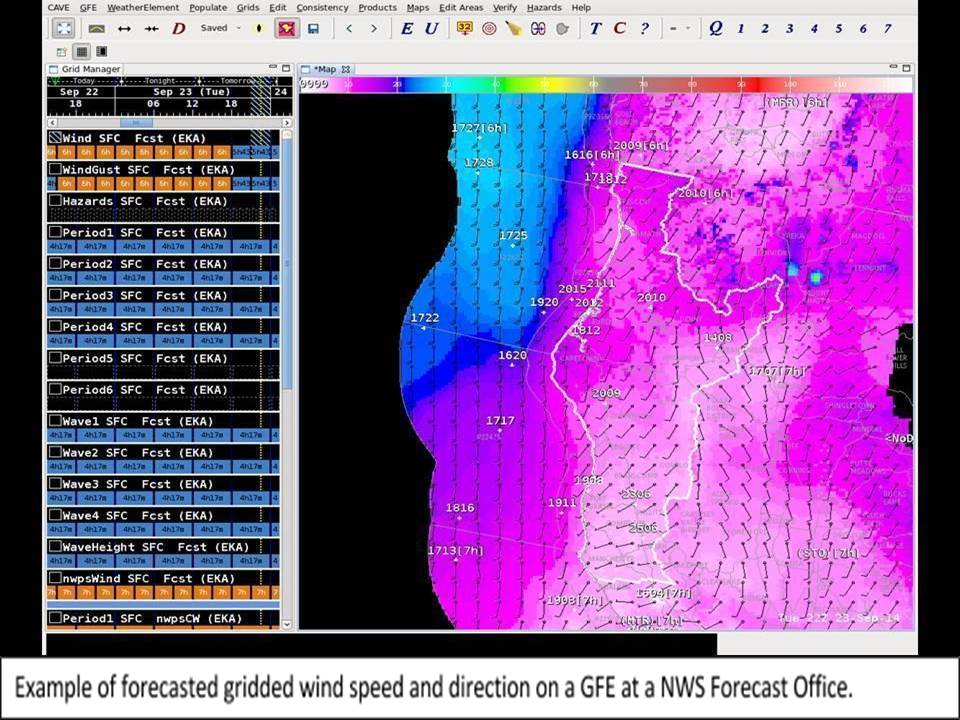
Across nearly all the U.S. coastal waters the NWS uses a Graphical Forecast Editor (GFE) to create the marine forecast. GFE is a gridded database in which each grid represents a 2.5km square area and allows the forecasters to define a value for a given weather element (wind, wave, period, etc.) within an individual grid.
Creating a strong marine forecast always begins by verifying model data against current conditions. Model assessment should originate at the synoptic scale (a large area) then downscaled to the local area. If models have initialized well against observed data then the forecast process may proceed easily. However, if the models are not handling the current situation well, which is typically the case along complex coastlines, then local knowledge and high resolution atmospheric models should be utilized. The marine forecaster should be able to mentally correct for model inadequacies and include this information into GFE.
GFE is where the marine forecaster creates a foundational dataset by assigning specific values to each of the grids, described previously. From this foundational dataset all marine products will emanate. Within GFE the wind field should be the first edited by the marine forecaster, as winds provide the forcing to generate local waves. In some areas there are meso-scale wind effects or timing issues that models may not pick up on which the marine forecaster needs to include into the foundational dataset. As such, standard tools that are used to populate the gridded wind field with model data may not be appropriate. In these cases it will take a personalized touch from the marine forecaster to ensure the winds are correct for the situation. Tools and methodologies to populate the wind field can vary from office to office depending upon local needs. The NWS provides a wind forecast that goes out to minimum of seven days.
Once the wind grids are in place the marine forecaster will being to assess the local wave regime. Many coastal offices within the NWS solely provide a singular wave height with the addition of primary wave direction and period at the offices discretion. Offices in the Pacific basin tend to include multiple wave systems including their direction, height, and period. For the purposes here, we will highlight the Pacific basin while making reference to the others.
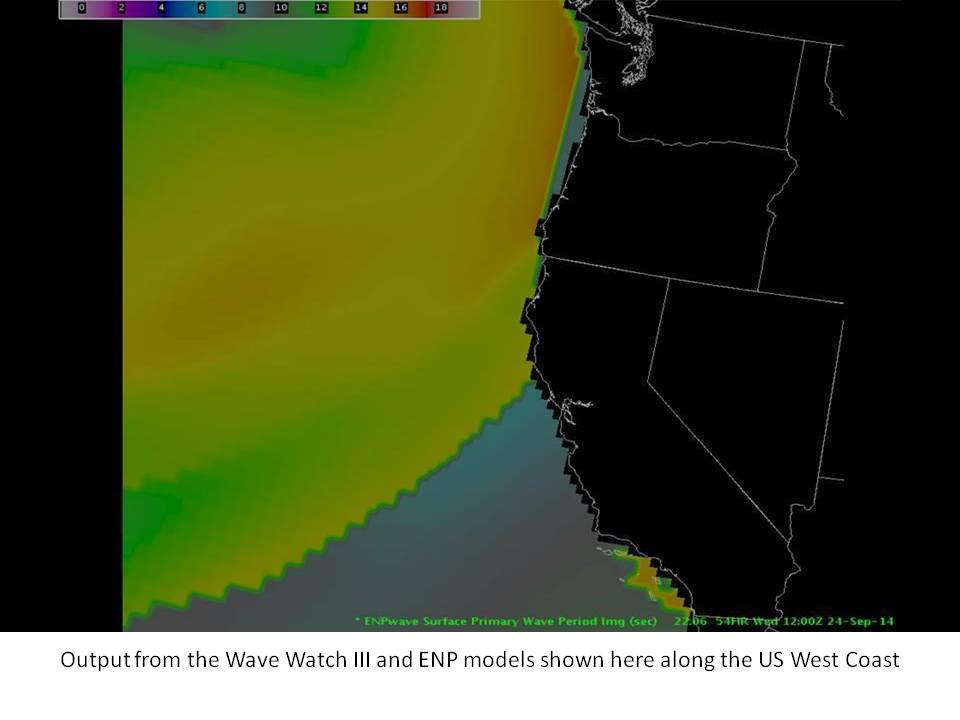
For NWS offices along the west coast and Gulf of Mexico the Simulating Waves Near-shore (SWAN) model is available to generate local waves based on the edited wind grids the marine forecaster would have already completed. Other offices that do not use SWAN would rely on tools that derive local wave energy based on wind speed from the GFE wind grids. Outside the local wave energy is distant source wave energy. This is accounted for by the Wavewatch model.
Mariners are interested in waves that will make their time at sea rough. This could be in the form of a steep locally generated wave or a couple different waves arriving from differing directions which can make for an uncomfortable ride. When utilizing the SWAN model, the marine forecaster can expect to wait a short time for the model to run and return data useful for GFE. After the data returns it will need to be quality controlled to verify how well it has initialized against current conditions, similar to the winds previously. If the model has initialized well and seems to be handling the forecast situation in an acceptable manner, the marine forecaster can populate the local waves with data from SWAN and non-local wave data from the Wavewatch. Usually minor manipulations are needed to adjust model wave data toward observed wave data. Tools have been developed to perform such tasks within GFE.
For the west coast marine forecaster there are typically three wave systems available for use in GFE. While each is not utilized at all times it allows for placement of a steep locally generated wave and two separate distant source waves (or swells). Once quality control has been completed the marine forecaster uses tools within GFE to pull model data into the foundational dataset. It will be up to the forecaster to decide which and how much data to put into the foundational dataset, but will be based on current and developing conditions. Some basic editing may be needed to clean up these forecast grids in the foundational dataset.
Now that the wind and wave grids are complete and representative current conditions, products can be generated using the information from the foundational dataset. The most widely seen product across the coastal waters and Great Lakes is the coastal waters and open lakes forecast. To generate this product the marine forecaster will run a program that samples the individual grid points over a particular area then calculates an average (typically a weighted average) which is returned in the form of a discrete value in the text forecast. The program will perform this averaging for each wind, wave, and period timeframe in the forecast.
The coastal waters and open lakes forecast’s are not the only product that can be generated from the foundational dataset. This dataset is the base for all marine forecast information and simply needs to be told what to return. Some offices have had success running a surf zone forecast in support of user groups like surfers and crabbers. A “bar” forecast can also be generated from the foundational dataset for mariners going into or out of a harbor. Again, the forecast data is there once the marine forecaster has entered the latest and best information, all that needs to be done now is to have someone tell it what products to yield.
Products that fall out of the foundational dataset can be found online from local forecast offices, as well as on NOAA weather radio.
Outside of coastal forecast offices, the NWS also has a few National Centers that have responsibilities for the high seas of the Atlantic and Pacific from around the equator to high latitudes of around 70°N. The high seas forecast data is slowly transitioning toward a GFE based forecast. However, the geographical area that is covered is much too immense at this time to easily grid and entire basin and have a computer process those fields with any timeliness. That said, steps have been taken to bring the offshore waters (60 to 250 nautical miles from the coast, as well as the Gulf of Mexico, Caribbean Sea, and the Bering Sea) into the modern era of gridded forecasts.
Currently, the high seas forecasts are done through a mix of graphical forecast charts which display the position, intensity and movement of lows and highs through time, and through a succinct text product that provide basic regions of marine warnings and forecast conditions.
Regardless of which office a marine forecaster is located in, the steps are the same. First is to compare model data to observed data to verify consistency. Second is to generate a foundational dataset that begins with observed data then runs out in time with the best forecast based on the understanding of the atmosphere. Third is to run programs that pull data from the foundational dataset to create forecast text and graphical products. Finally, and this should be done at each step, quality control everything to ensure the best information is making it out. The best information will lead to the best decisions which will lead to saving lives, moving vessels most efficiently, and building our Nation’s economy.
Meteorologists are looking into the future where more and higher resolution remote sensing can be achieved. This will come in broader areas of satellite derived winds and seas, greater detail of sea surface, and more and better shipboard observations. The possibility even exists, with cost effective technology, that ships may carry their own remote sensing equipment, such as highly detailed weather radars, which could replace the coarse radars aboard ships now. The modern mariner now includes anyone from merchant mariners to pleasure crafting weekend recreational boaters.
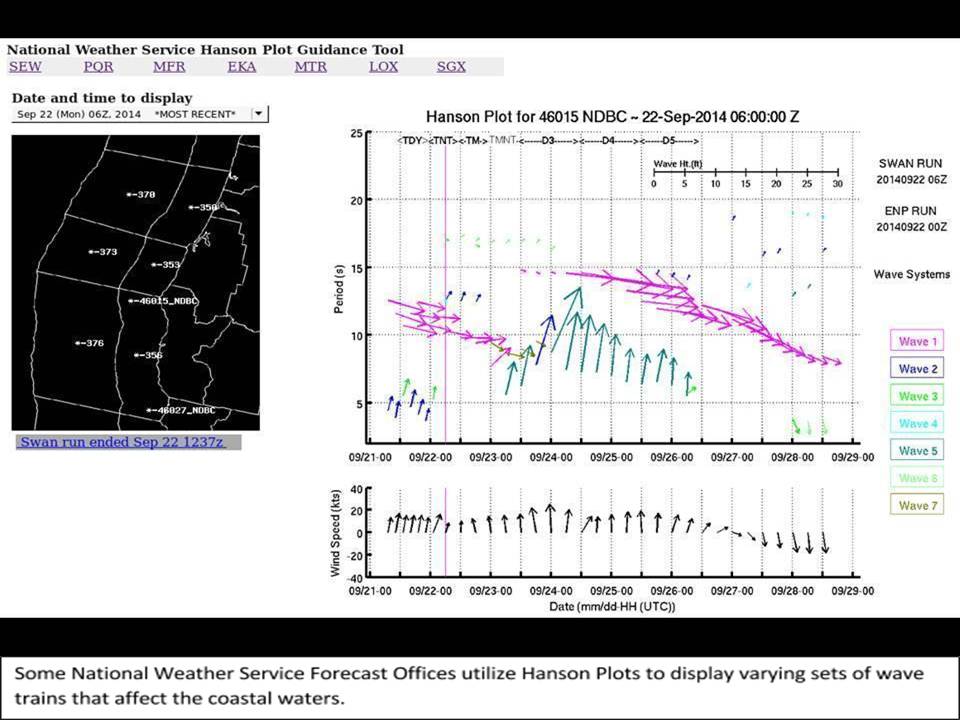
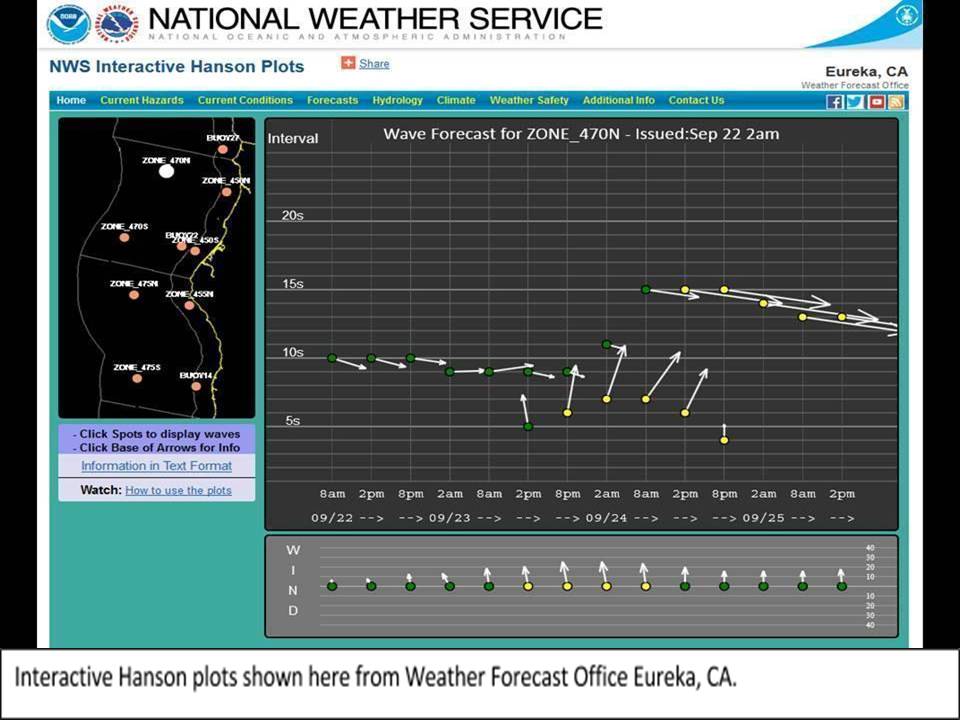
The Future of Marine Weather Forecasting in the National Weather Service
The National Weather Service (NWS) routinely assesses its marine weather forecast products and services to identify areas of improvement. Future strategic planning for all NWS products and services revolves around the concept of building a Weather-Ready Nation. NOAA’s Weather-Ready Nation is about building community resilience in the face of increasing vulnerability to extreme weather and water events. For more information on NOAA’s Weather Ready Nation go to: http://www.nws.noaa.gov/com/weatherreadynation/#.VA8VdvldVHU
Services – Mobile Devices and Internet
With the popularity of mobile electronic devices such as smart phones and tablets increasing rapidly, the NWS recognizes the need to make its most critical information available via mobile devices. The NWS sends urgent weather warnings via Wireless Emergency Alerts (WEA); text messages sent by authorized government alerting authorities through mobile carriers. Marine weather messages currently sent through WEA are Tsunami Warning, Typhoon Warning, and Hurricane Warning and there are plans to add more urgent marine weather messages to WEA in the future. For more information on WEA, go to: http://www.nws.noaa.gov/com/weatherreadynation/wea.html#.VA8W-vldVHV. The NWS also has a mobile version of their webpage at www.mobile.weather.gov and at www.cell.weather.gov, one can get text products for a mobile device.
The NWS will make the National Marine Weather Web Portal operational in the near future. It is currently experimental and can be viewed at: http://preview.weather.gov/mwp. This new portal displays hazards, forecasts, observations and many other data layers useful for briefing mariners, coastal managers, emergency managers and first responders on current and future marine weather. This web page can be configured to display information pertinent to a geographic area. Forecast tracks of tropical systems will be available along with other vital datasets such as tides, sea surface temperatures and analysis and forecasts of key marine variables such as wind, wind gusts, significant wave height and surface water currents.
Product Improvement - Graphics
Graphical marine weather products will be an important part of the future of marine weather forecasting. For example, the Tropical Analysis and Forecast Branch (TAFB), the Ocean Prediction Center (OPC) and the Honolulu Weather Forecast Office (HFO) will provide graphical forecasts (on an experimental basis) for their offshore waters and high seas forecast areas of responsibility for the Atlantic and Pacific basins. The Weather Forecast Offices (WFOs) in Fairbanks, Anchorage and Juneau, Alaska will provide (experimentally) graphical forecasts over their offshore waters in the Arctic basin. For an example of what these look like, go to: http://www.nhc.noaa.gov/marine/grids.php
Improvements in Wave Forecasting
NWS offices are testing an experimental enhancement to their Coastal Waters Forecast (CWF), additional wave height fields using advanced theoretical statistics (Rayleigh Distribution.) Future marine forecasts will have several different wave statistics based on this Distribution; such as the Significant Wave Height (HS) and the average height of the highest 10 percent of waves (H1/10) observed at sea.
The current CWF product provides a forecast range of the expected significant wave height (average height of the highest 1/3 of the waves) across the coastal waters. For example: "Tonight...Northwest winds 13 to 18 knots becoming northeast 16 to 21 knots. Seas 2 to 4 feet building to 4 to 6 feet late. Dominant period 6 seconds. Intracoastal waters choppy in exposed areas. slight chance of showers."
Adding the highest 10 percent of waves height to the CWF product will provide a more descriptive and accurate assessment of the wave field expected for any particular time across a given marine zone. User knowledge of this information could reduce the number of marine accidents at sea, saving lives.
For example an improved forecast will look like the following: "Tonight...Northwest winds 13 to 18 knots becoming northeast 16 to 21 knots. Seas 2 to 4 feet with occasional 5 feet building to 4 to 6 feet with occasional 8 feet possible late. Dominant period 6 seconds. Intracoastal waters choppy in exposed areas. Slight chance of showers."
Digital Forecast Improvements
The NWS is improving its forecasts for major shipping channels by using digital forecast data. For example, the Tampa Bay Marine Channel Forecast (experimental) uses digital forecast data of winds, gusts, waves, weather, rain chance, and hazards and also includes water level relative to mean sea level. The Marine Channel Forecast is displayed on a static Google map with the Tampa Bay shipping channel and the forecast points overlaid. Users may click on any forecast point to view the forecast. The Marine Channel Forecast is currently available at the following web address: http://www.srh.noaa.gov/tbw/?n=marinechannelsforecast
Storm Surge
In an effort to improve overall awareness and understanding of the storm surge flooding threat, the NWS is working towards implementing a storm surge watch/warning which would be issued for life threatening storm surge events. Storm surge is an abnormal rise of water generated by a storm (tropical or non tropical), over and above the predicted astronomical tides. Storm surge is the greatest weather related threat to life and property along the coast.
In 2014, the NHC began issuing an experimental Potential Storm Surge Flooding map. The Potential Storm Surge Flooding Map is an experimental product (Google interface) which depicts the risk associated with the storm surge hazard from a tropical cyclone. The map shows, geographical areas where inundation from storm surge could occur and how high above ground the water could reach in those areas. The map is based on the forecast track, intensity, and size of a tropical storm or hurricane. Plans are for the product to remain experimental for 2 years and become operational in 2016. The experimental Potential Storm Surge Flooding Map paves the way for a graphical depiction of storm surge flooding from non tropical storm surge in the future. In the future, the storm surge watch/warning and Potential Flooding Map will be provided in a GIS format.
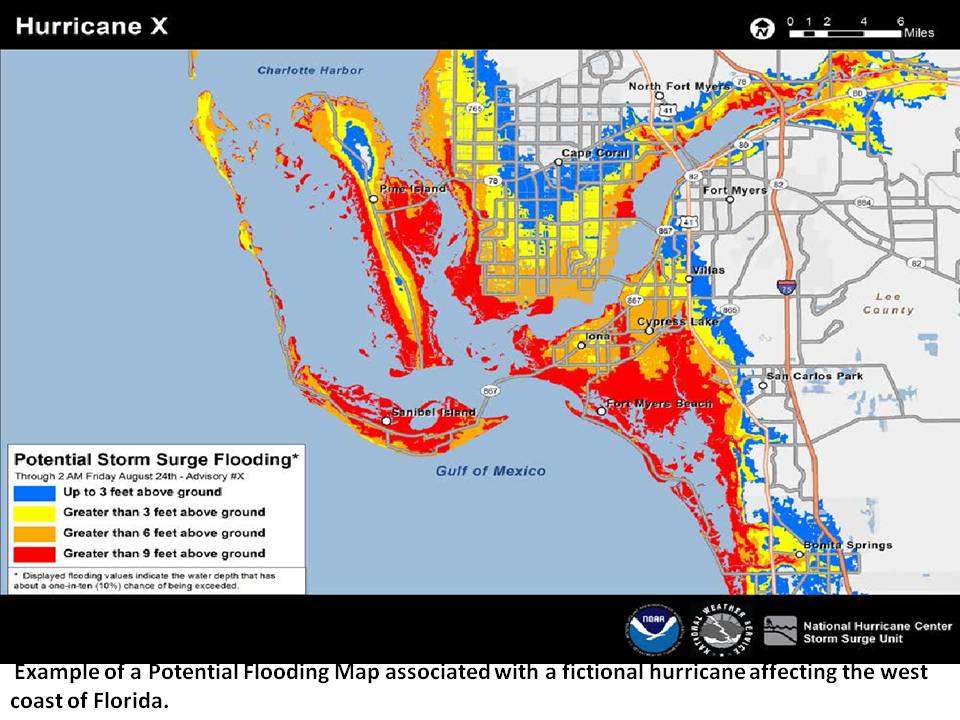
The map will be part of an interactive display made available on the NHC website (http://www.nhc.noaa.gov/) in situations where hurricane watches and warning are in effect for portions of the continental U.S. The map will be experimental for at least two years (2015 and 2016). This effort will be expanded for tropical cyclones in the Pacific Ocean and similar products and services for storm surge associated with non tropical storms are also being developed.
Near Shore Wave Prediction
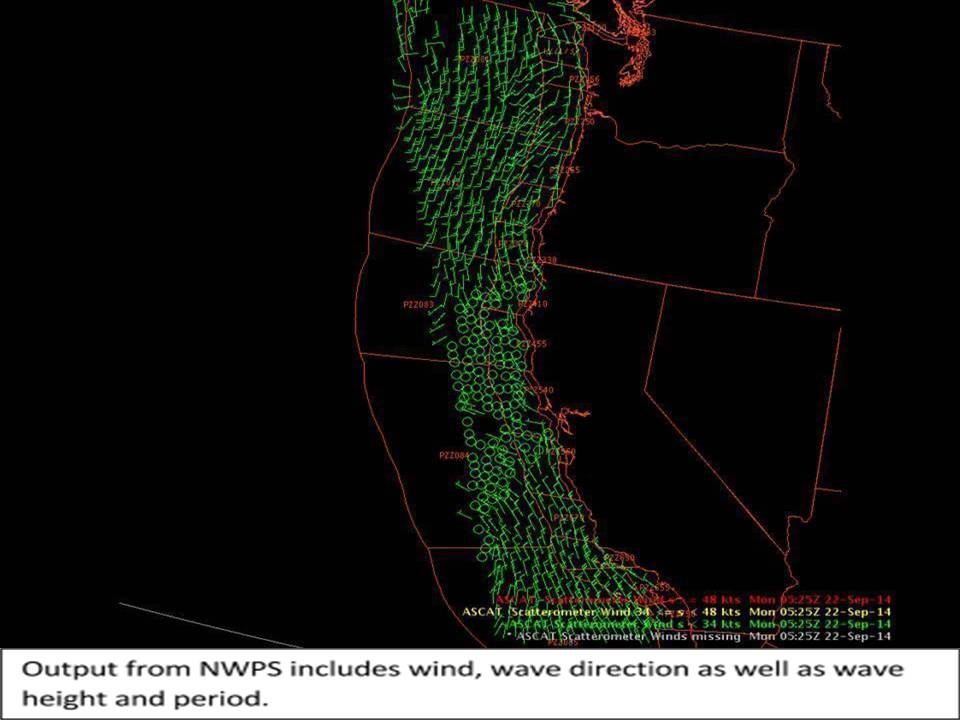
The Near shore Wave Prediction System (NWPS) is a numerical modeling system designed to provide routine and on-demand, high-resolution near shore wave model guidance to coastal NWS forecasters throughout the United States. For more information, go to: http://polar.ncep.noaa.gov/waves/nwps/ The development of NWPS will enhance the forecasting skill for surf zone hazards by providing guidance on a space and time scale small enough to capture common hazards of the surf zone such as rip currents. A statistical rip current forecasting model is under development using NWPS. The new model will provide consistent rip current forecast guidance to specific beaches; a much smaller scale than the current forecasting methods.
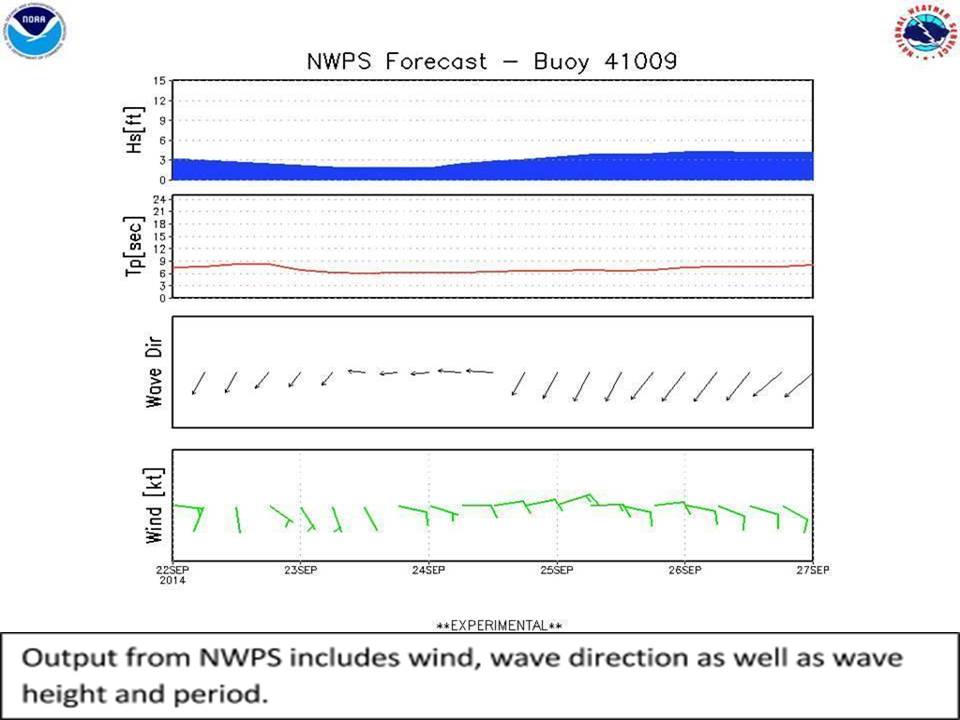
For a complete listing of NWS marine forecasts and services, visit the Marine and Coastal Services Branch webpage at: http://www.nws.noaa.gov/om/marine/home.htm
National Weather Service (NWS) Marine Weather Forecasting – Conclusion
The NWS and marine weather forecasting within NWS began in the 1870s. For the first 30 years or so, the marine weather program in the NWS provided mainly observations at sea and not much in the way of predicting future conditions. In the early 1900s, a better understanding of the atmosphere began to emerge and rapid advances in radio communication took marine weather forecasting to a new level of future prediction.
The sinking of the RMS Titanic in 1912 created a need for international marine weather forecasting policies. A defining moment in marine weather forecasting within the U.S. Government came when accurate wind and tide forecasts helped make the decision to invade Normandy during WW II.
Advances in satellite technology greatly improved forecasting of tropical cyclones and international broadcasts of marine meteorological information allowed for a much wider audience to receive important marine weather forecasts. These two developments significantly reduced the number of lives lost due to extreme marine weather events.
In the past 100 years, techniques have come a long way bringing us into the modern era of marine weather forecasting using sophisticated computer programs, and marine observations via satellite and buoys. Today marine forecasting is a complex task of viewing data, both observed and model, then synthesizing it through knowledge and experience. The NWS marine forecaster then uses powerful workstation computers to create forecasts – in both graphic and text formats.
Warning of hazardous phenomena is the most critical aspect to the marine forecast. Protection of life and property is of the utmost importance. Warnings must be issued in a timely manner when hazardous conditions are occurring or expected. Hazards include tropical and non-tropical cyclones, high winds and waves, thunderstorms, ice accretion, reduced visibilities, sea ice, and rising water at the shorelines.
When a forecast or warning message is complete, it must be communicated to users in a timely manner. Marine weather forecasts and warnings are disseminated to mariners at sea via voice radio frequencies, radio teletype, and satellite broadcasts. As more mariners take mobile phones out on the water, the NWS is making its information available in user friendly formats via these mobile devices.
Meteorologists are looking into the future where more and higher resolution remote sensing can be achieved. This will come in broader areas of satellite derived winds and seas, greater detail of sea surface, more and better shipboard observations, and possible highly detailed weather radars on ships.
In the future, The National Weather Service will improve its marine weather services by developing products and services which can be easily viewed on mobile electronic devices and the Internet. The NWS will continue to develop more graphical products and digital forecasts which along with text products will enhance understanding of weather information and decision making based on weather information. Current experimental projects within the National Weather Service will allow for improvements in critical components of marine weather forecasting such as waves, storm surge and near shore wave conditions.
Back to top